Immigrants from Colombia vs Yaqui College, 1 year or more
COMPARE
Immigrants from Colombia
Yaqui
College, 1 year or more
College, 1 year or more Comparison
Immigrants from Colombia
Yaqui
57.8%
COLLEGE, 1 YEAR OR MORE
11.6/ 100
METRIC RATING
214th/ 347
METRIC RANK
53.2%
COLLEGE, 1 YEAR OR MORE
0.0/ 100
METRIC RATING
295th/ 347
METRIC RANK
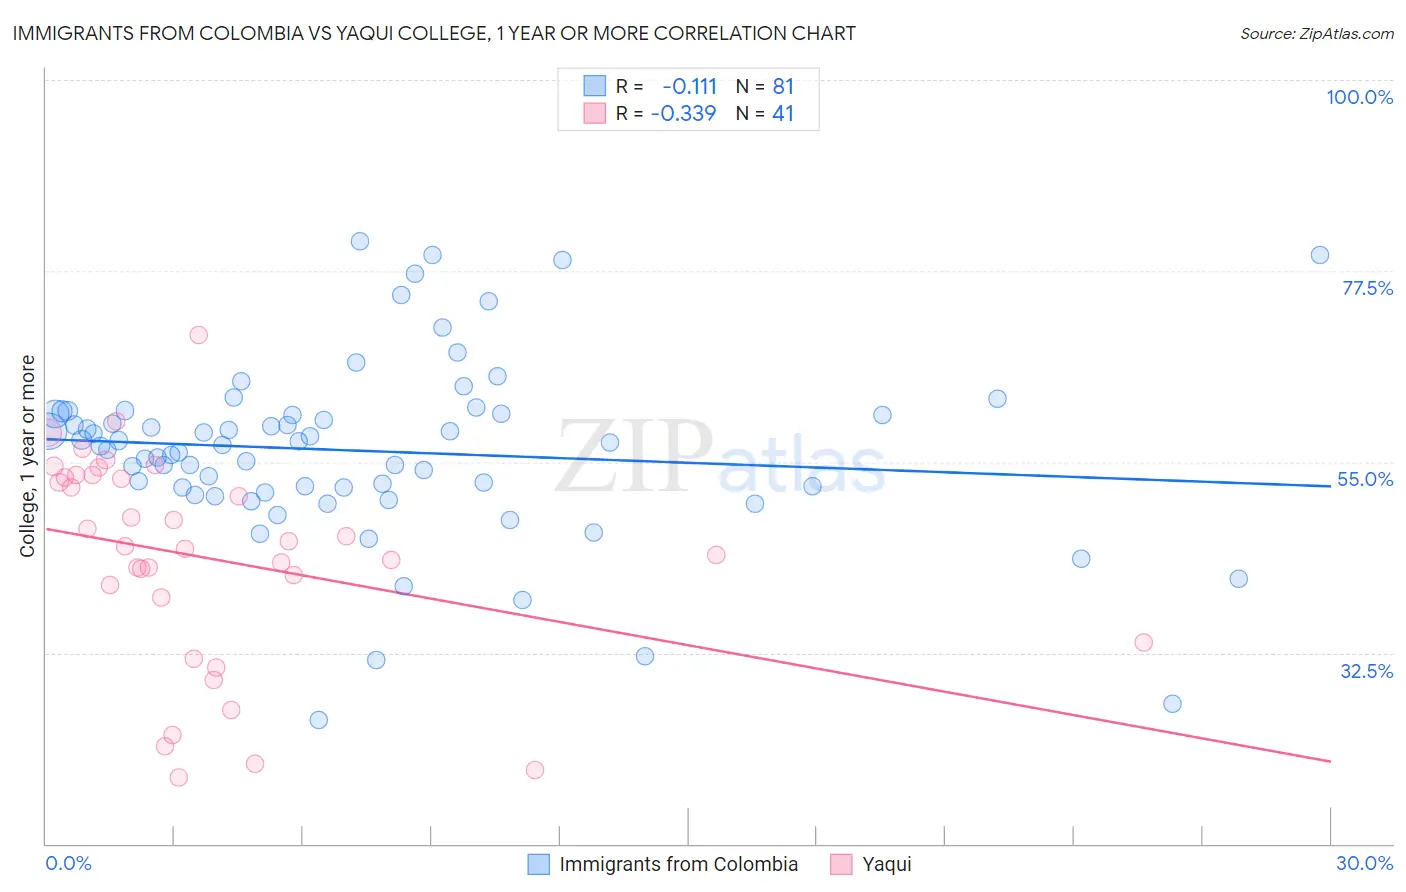
Immigrants from Colombia vs Yaqui College, 1 year or more Correlation Chart
The statistical analysis conducted on geographies consisting of 378,687,641 people shows a poor negative correlation between the proportion of Immigrants from Colombia and percentage of population with at least college, 1 year or more education in the United States with a correlation coefficient (R) of -0.111 and weighted average of 57.8%. Similarly, the statistical analysis conducted on geographies consisting of 107,738,640 people shows a mild negative correlation between the proportion of Yaqui and percentage of population with at least college, 1 year or more education in the United States with a correlation coefficient (R) of -0.339 and weighted average of 53.2%, a difference of 8.7%.
College, 1 year or more Correlation Summary
| Measurement | Immigrants from Colombia | Yaqui |
| Minimum | 24.6% | 17.9% |
| Maximum | 81.0% | 69.9% |
| Range | 56.4% | 52.0% |
| Mean | 56.3% | 43.6% |
| Median | 57.0% | 45.0% |
| Interquartile 25% (IQ1) | 51.7% | 36.3% |
| Interquartile 75% (IQ3) | 60.7% | 53.3% |
| Interquartile Range (IQR) | 9.0% | 17.0% |
| Standard Deviation (Sample) | 10.7% | 12.5% |
| Standard Deviation (Population) | 10.6% | 12.3% |
Similar Demographics by College, 1 year or more
Demographics Similar to Immigrants from Colombia by College, 1 year or more
In terms of college, 1 year or more, the demographic groups most similar to Immigrants from Colombia are Tongan (57.8%, a difference of 0.0%), Immigrants from Senegal (57.8%, a difference of 0.030%), French Canadian (57.8%, a difference of 0.030%), Immigrants from Peru (57.7%, a difference of 0.14%), and Immigrants from Nigeria (57.9%, a difference of 0.21%).
| Demographics | Rating | Rank | College, 1 year or more |
| Senegalese | 16.9 /100 | #207 | Poor 58.2% |
| Immigrants | Uruguay | 15.2 /100 | #208 | Poor 58.1% |
| Immigrants | Middle Africa | 14.0 /100 | #209 | Poor 58.0% |
| Tsimshian | 13.5 /100 | #210 | Poor 57.9% |
| Immigrants | Nigeria | 13.3 /100 | #211 | Poor 57.9% |
| Immigrants | Senegal | 11.8 /100 | #212 | Poor 57.8% |
| French Canadians | 11.8 /100 | #213 | Poor 57.8% |
| Immigrants | Colombia | 11.6 /100 | #214 | Poor 57.8% |
| Tongans | 11.6 /100 | #215 | Poor 57.8% |
| Immigrants | Peru | 10.6 /100 | #216 | Poor 57.7% |
| Immigrants | Panama | 9.1 /100 | #217 | Tragic 57.6% |
| Native Hawaiians | 9.0 /100 | #218 | Tragic 57.6% |
| Whites/Caucasians | 8.7 /100 | #219 | Tragic 57.6% |
| Immigrants | Costa Rica | 8.0 /100 | #220 | Tragic 57.5% |
| Immigrants | Ghana | 7.7 /100 | #221 | Tragic 57.4% |
Demographics Similar to Yaqui by College, 1 year or more
In terms of college, 1 year or more, the demographic groups most similar to Yaqui are Cherokee (53.2%, a difference of 0.010%), Black/African American (53.3%, a difference of 0.23%), Chickasaw (53.3%, a difference of 0.25%), Sioux (53.0%, a difference of 0.34%), and Cuban (53.4%, a difference of 0.38%).
| Demographics | Rating | Rank | College, 1 year or more |
| Alaska Natives | 0.0 /100 | #288 | Tragic 53.4% |
| Immigrants | Ecuador | 0.0 /100 | #289 | Tragic 53.4% |
| Alaskan Athabascans | 0.0 /100 | #290 | Tragic 53.4% |
| Cubans | 0.0 /100 | #291 | Tragic 53.4% |
| Chickasaw | 0.0 /100 | #292 | Tragic 53.3% |
| Blacks/African Americans | 0.0 /100 | #293 | Tragic 53.3% |
| Cherokee | 0.0 /100 | #294 | Tragic 53.2% |
| Yaqui | 0.0 /100 | #295 | Tragic 53.2% |
| Sioux | 0.0 /100 | #296 | Tragic 53.0% |
| Paiute | 0.0 /100 | #297 | Tragic 52.9% |
| Immigrants | Dominica | 0.0 /100 | #298 | Tragic 52.5% |
| Immigrants | Nicaragua | 0.0 /100 | #299 | Tragic 52.4% |
| Choctaw | 0.0 /100 | #300 | Tragic 52.3% |
| Haitians | 0.0 /100 | #301 | Tragic 52.3% |
| Puerto Ricans | 0.0 /100 | #302 | Tragic 52.2% |