Immigrants from China vs Indonesian Householder Income Under 25 years
COMPARE
Immigrants from China
Indonesian
Householder Income Under 25 years
Householder Income Under 25 years Comparison
Immigrants from China
Indonesians
$57,931
HOUSEHOLDER INCOME UNDER 25 YEARS
100.0/ 100
METRIC RATING
11th/ 347
METRIC RANK
$45,566
HOUSEHOLDER INCOME UNDER 25 YEARS
0.0/ 100
METRIC RATING
330th/ 347
METRIC RANK
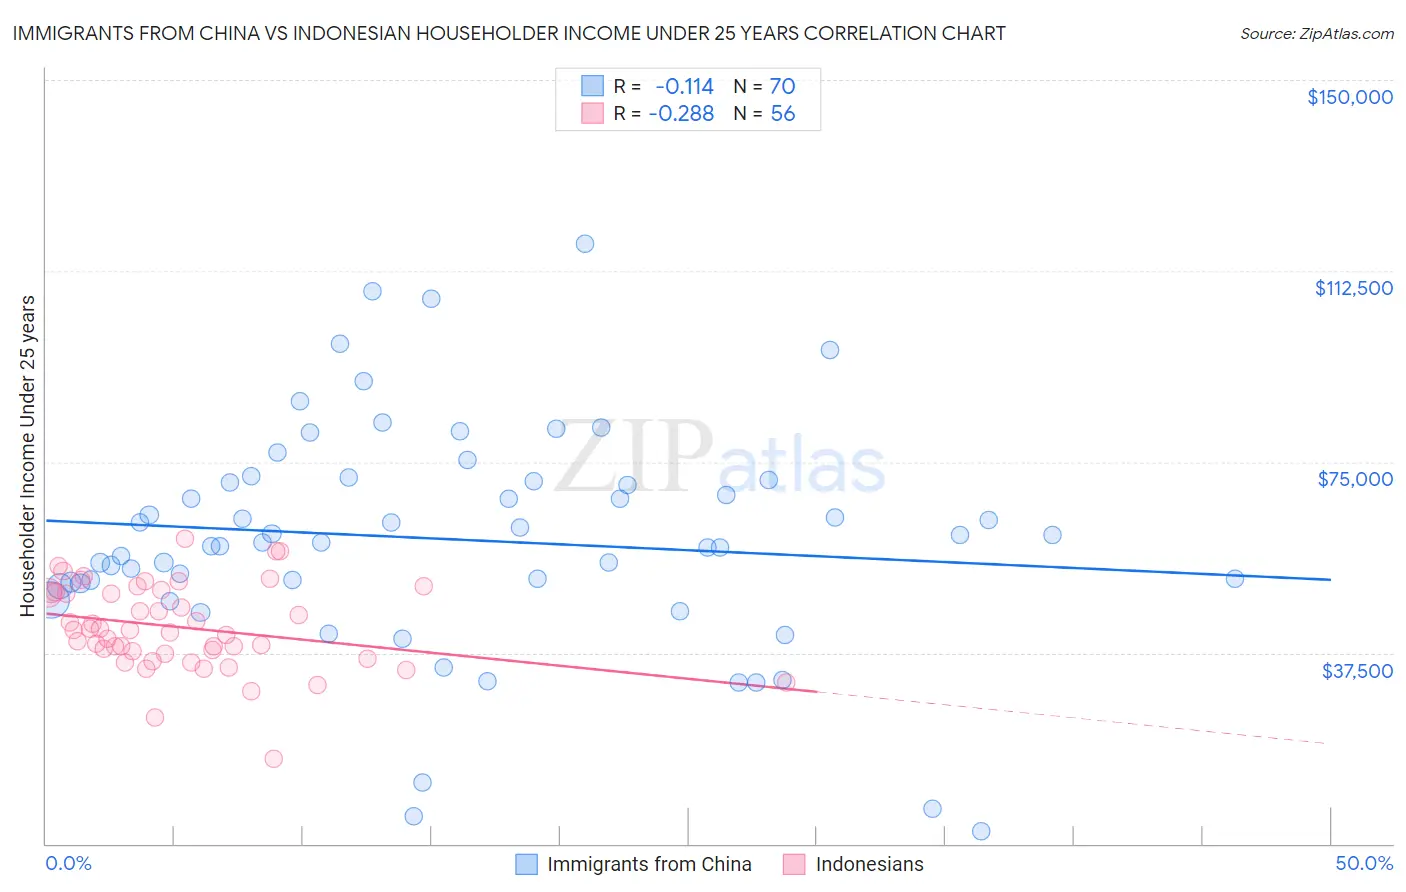
Immigrants from China vs Indonesian Householder Income Under 25 years Correlation Chart
The statistical analysis conducted on geographies consisting of 376,634,050 people shows a poor negative correlation between the proportion of Immigrants from China and household income with householder under the age of 25 in the United States with a correlation coefficient (R) of -0.114 and weighted average of $57,931. Similarly, the statistical analysis conducted on geographies consisting of 151,007,148 people shows a weak negative correlation between the proportion of Indonesians and household income with householder under the age of 25 in the United States with a correlation coefficient (R) of -0.288 and weighted average of $45,566, a difference of 27.1%.
Householder Income Under 25 years Correlation Summary
| Measurement | Immigrants from China | Indonesian |
| Minimum | $2,499 | $16,806 |
| Maximum | $117,772 | $59,867 |
| Range | $115,273 | $43,061 |
| Mean | $59,820 | $42,559 |
| Median | $59,134 | $41,985 |
| Interquartile 25% (IQ1) | $51,147 | $37,574 |
| Interquartile 75% (IQ3) | $71,074 | $49,366 |
| Interquartile Range (IQR) | $19,928 | $11,792 |
| Standard Deviation (Sample) | $22,263 | $8,431 |
| Standard Deviation (Population) | $22,103 | $8,355 |
Similar Demographics by Householder Income Under 25 years
Demographics Similar to Immigrants from China by Householder Income Under 25 years
In terms of householder income under 25 years, the demographic groups most similar to Immigrants from China are Immigrants from Philippines ($57,930, a difference of 0.0%), Afghan ($58,019, a difference of 0.15%), Immigrants from South Central Asia ($57,818, a difference of 0.20%), Filipino ($57,740, a difference of 0.33%), and Korean ($57,730, a difference of 0.35%).
| Demographics | Rating | Rank | Householder Income Under 25 years |
| Immigrants | Taiwan | 100.0 /100 | #4 | Exceptional $59,424 |
| Immigrants | Bolivia | 100.0 /100 | #5 | Exceptional $59,389 |
| Thais | 100.0 /100 | #6 | Exceptional $59,187 |
| Bolivians | 100.0 /100 | #7 | Exceptional $58,506 |
| Indians (Asian) | 100.0 /100 | #8 | Exceptional $58,239 |
| Chinese | 100.0 /100 | #9 | Exceptional $58,162 |
| Afghans | 100.0 /100 | #10 | Exceptional $58,019 |
| Immigrants | China | 100.0 /100 | #11 | Exceptional $57,931 |
| Immigrants | Philippines | 100.0 /100 | #12 | Exceptional $57,930 |
| Immigrants | South Central Asia | 100.0 /100 | #13 | Exceptional $57,818 |
| Filipinos | 100.0 /100 | #14 | Exceptional $57,740 |
| Koreans | 100.0 /100 | #15 | Exceptional $57,730 |
| Immigrants | Afghanistan | 100.0 /100 | #16 | Exceptional $57,478 |
| Sierra Leoneans | 100.0 /100 | #17 | Exceptional $57,272 |
| Immigrants | Eastern Asia | 100.0 /100 | #18 | Exceptional $57,123 |
Demographics Similar to Indonesians by Householder Income Under 25 years
In terms of householder income under 25 years, the demographic groups most similar to Indonesians are Immigrants from Zaire ($45,529, a difference of 0.080%), Seminole ($45,649, a difference of 0.18%), German Russian ($45,673, a difference of 0.23%), Choctaw ($45,450, a difference of 0.25%), and Bahamian ($45,743, a difference of 0.39%).
| Demographics | Rating | Rank | Householder Income Under 25 years |
| Immigrants | Saudi Arabia | 0.0 /100 | #323 | Tragic $46,187 |
| Dutch West Indians | 0.0 /100 | #324 | Tragic $45,816 |
| Immigrants | Bahamas | 0.0 /100 | #325 | Tragic $45,793 |
| Osage | 0.0 /100 | #326 | Tragic $45,764 |
| Bahamians | 0.0 /100 | #327 | Tragic $45,743 |
| German Russians | 0.0 /100 | #328 | Tragic $45,673 |
| Seminole | 0.0 /100 | #329 | Tragic $45,649 |
| Indonesians | 0.0 /100 | #330 | Tragic $45,566 |
| Immigrants | Zaire | 0.0 /100 | #331 | Tragic $45,529 |
| Choctaw | 0.0 /100 | #332 | Tragic $45,450 |
| Creek | 0.0 /100 | #333 | Tragic $45,371 |
| Cajuns | 0.0 /100 | #334 | Tragic $45,338 |
| Cheyenne | 0.0 /100 | #335 | Tragic $45,275 |
| Tohono O'odham | 0.0 /100 | #336 | Tragic $45,248 |
| Pueblo | 0.0 /100 | #337 | Tragic $45,018 |