Immigrants from China vs Indonesian 4th Grade
COMPARE
Immigrants from China
Indonesian
4th Grade
4th Grade Comparison
Immigrants from China
Indonesians
97.0%
4TH GRADE
0.3/ 100
METRIC RATING
266th/ 347
METRIC RANK
96.2%
4TH GRADE
0.0/ 100
METRIC RATING
313th/ 347
METRIC RANK
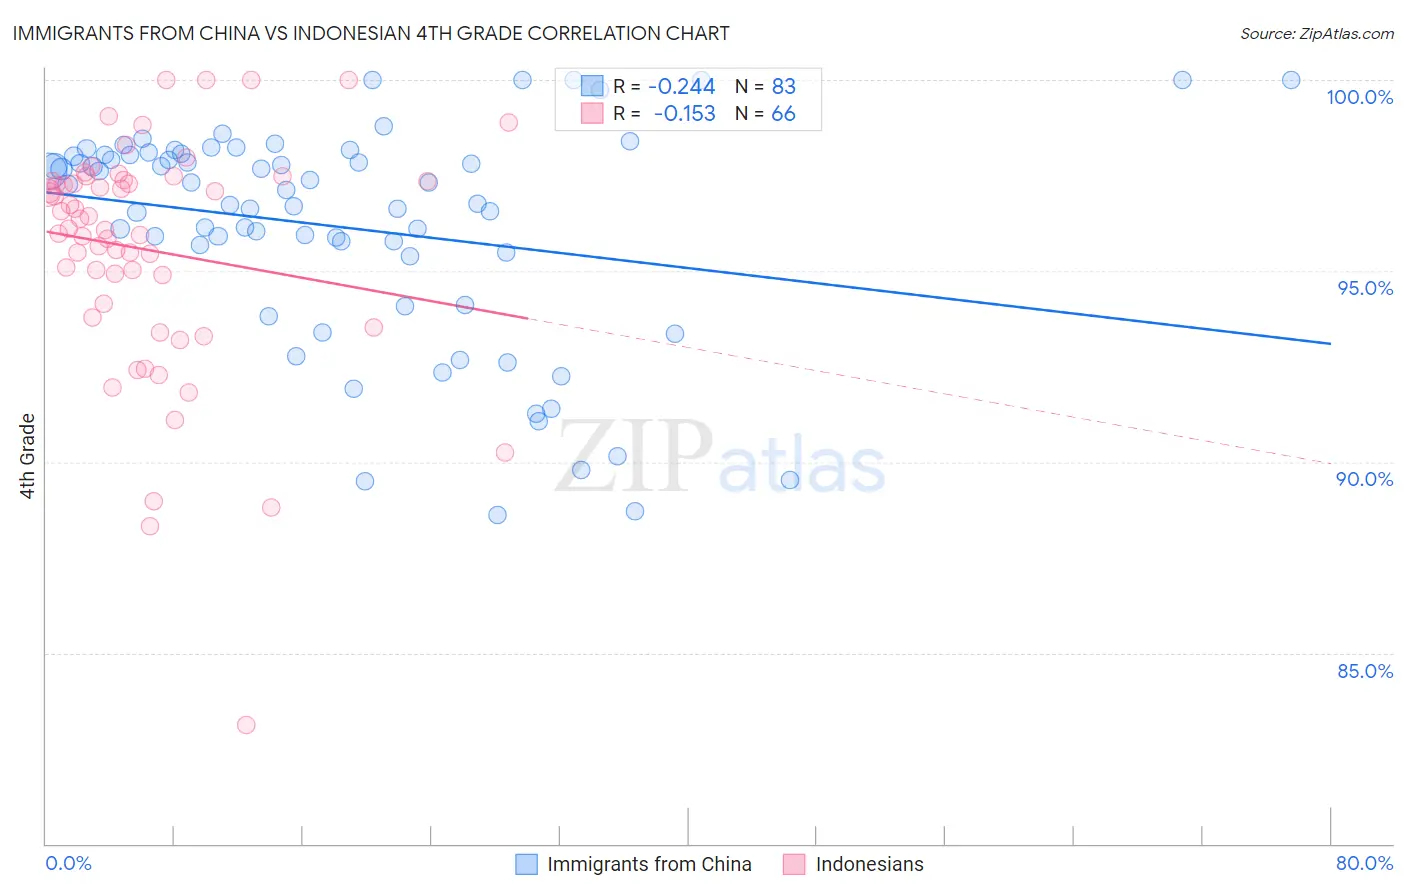
Immigrants from China vs Indonesian 4th Grade Correlation Chart
The statistical analysis conducted on geographies consisting of 457,082,957 people shows a weak negative correlation between the proportion of Immigrants from China and percentage of population with at least 4th grade education in the United States with a correlation coefficient (R) of -0.244 and weighted average of 97.0%. Similarly, the statistical analysis conducted on geographies consisting of 162,727,113 people shows a poor negative correlation between the proportion of Indonesians and percentage of population with at least 4th grade education in the United States with a correlation coefficient (R) of -0.153 and weighted average of 96.2%, a difference of 0.78%.
4th Grade Correlation Summary
| Measurement | Immigrants from China | Indonesian |
| Minimum | 88.6% | 83.1% |
| Maximum | 100.0% | 100.0% |
| Range | 11.4% | 16.9% |
| Mean | 96.1% | 95.5% |
| Median | 97.1% | 96.2% |
| Interquartile 25% (IQ1) | 95.4% | 94.1% |
| Interquartile 75% (IQ3) | 98.0% | 97.4% |
| Interquartile Range (IQR) | 2.7% | 3.2% |
| Standard Deviation (Sample) | 2.9% | 3.1% |
| Standard Deviation (Population) | 2.9% | 3.1% |
Similar Demographics by 4th Grade
Demographics Similar to Immigrants from China by 4th Grade
In terms of 4th grade, the demographic groups most similar to Immigrants from China are Immigrants from Nigeria (97.0%, a difference of 0.0%), Taiwanese (97.0%, a difference of 0.010%), Armenian (97.0%, a difference of 0.010%), Ghanaian (97.0%, a difference of 0.010%), and Immigrants from Jamaica (97.0%, a difference of 0.020%).
| Demographics | Rating | Rank | 4th Grade |
| Immigrants | Ethiopia | 0.4 /100 | #259 | Tragic 97.0% |
| Immigrants | Sierra Leone | 0.4 /100 | #260 | Tragic 97.0% |
| Immigrants | South America | 0.4 /100 | #261 | Tragic 97.0% |
| West Indians | 0.4 /100 | #262 | Tragic 97.0% |
| Immigrants | Jamaica | 0.3 /100 | #263 | Tragic 97.0% |
| Taiwanese | 0.3 /100 | #264 | Tragic 97.0% |
| Armenians | 0.3 /100 | #265 | Tragic 97.0% |
| Immigrants | China | 0.3 /100 | #266 | Tragic 97.0% |
| Immigrants | Nigeria | 0.3 /100 | #267 | Tragic 97.0% |
| Ghanaians | 0.2 /100 | #268 | Tragic 97.0% |
| Immigrants | Uzbekistan | 0.2 /100 | #269 | Tragic 96.9% |
| Cubans | 0.2 /100 | #270 | Tragic 96.9% |
| Immigrants | Peru | 0.1 /100 | #271 | Tragic 96.9% |
| Fijians | 0.1 /100 | #272 | Tragic 96.9% |
| Immigrants | Cameroon | 0.1 /100 | #273 | Tragic 96.9% |
Demographics Similar to Indonesians by 4th Grade
In terms of 4th grade, the demographic groups most similar to Indonesians are Vietnamese (96.2%, a difference of 0.0%), Nicaraguan (96.2%, a difference of 0.010%), Immigrants from Ecuador (96.2%, a difference of 0.010%), Immigrants from Bangladesh (96.2%, a difference of 0.020%), and Cape Verdean (96.2%, a difference of 0.020%).
| Demographics | Rating | Rank | 4th Grade |
| Sri Lankans | 0.0 /100 | #306 | Tragic 96.4% |
| Immigrants | Haiti | 0.0 /100 | #307 | Tragic 96.3% |
| Immigrants | Laos | 0.0 /100 | #308 | Tragic 96.3% |
| Immigrants | Guyana | 0.0 /100 | #309 | Tragic 96.3% |
| Immigrants | Burma/Myanmar | 0.0 /100 | #310 | Tragic 96.3% |
| Immigrants | Bangladesh | 0.0 /100 | #311 | Tragic 96.2% |
| Cape Verdeans | 0.0 /100 | #312 | Tragic 96.2% |
| Indonesians | 0.0 /100 | #313 | Tragic 96.2% |
| Vietnamese | 0.0 /100 | #314 | Tragic 96.2% |
| Nicaraguans | 0.0 /100 | #315 | Tragic 96.2% |
| Immigrants | Ecuador | 0.0 /100 | #316 | Tragic 96.2% |
| Central American Indians | 0.0 /100 | #317 | Tragic 96.2% |
| Immigrants | Azores | 0.0 /100 | #318 | Tragic 96.1% |
| Belizeans | 0.0 /100 | #319 | Tragic 96.1% |
| Bangladeshis | 0.0 /100 | #320 | Tragic 96.1% |