Immigrants from China vs Immigrants from South America GED/Equivalency
COMPARE
Immigrants from China
Immigrants from South America
GED/Equivalency
GED/Equivalency Comparison
Immigrants from China
Immigrants from South America
86.9%
GED/EQUIVALENCY
93.2/ 100
METRIC RATING
119th/ 347
METRIC RANK
84.4%
GED/EQUIVALENCY
4.2/ 100
METRIC RATING
232nd/ 347
METRIC RANK
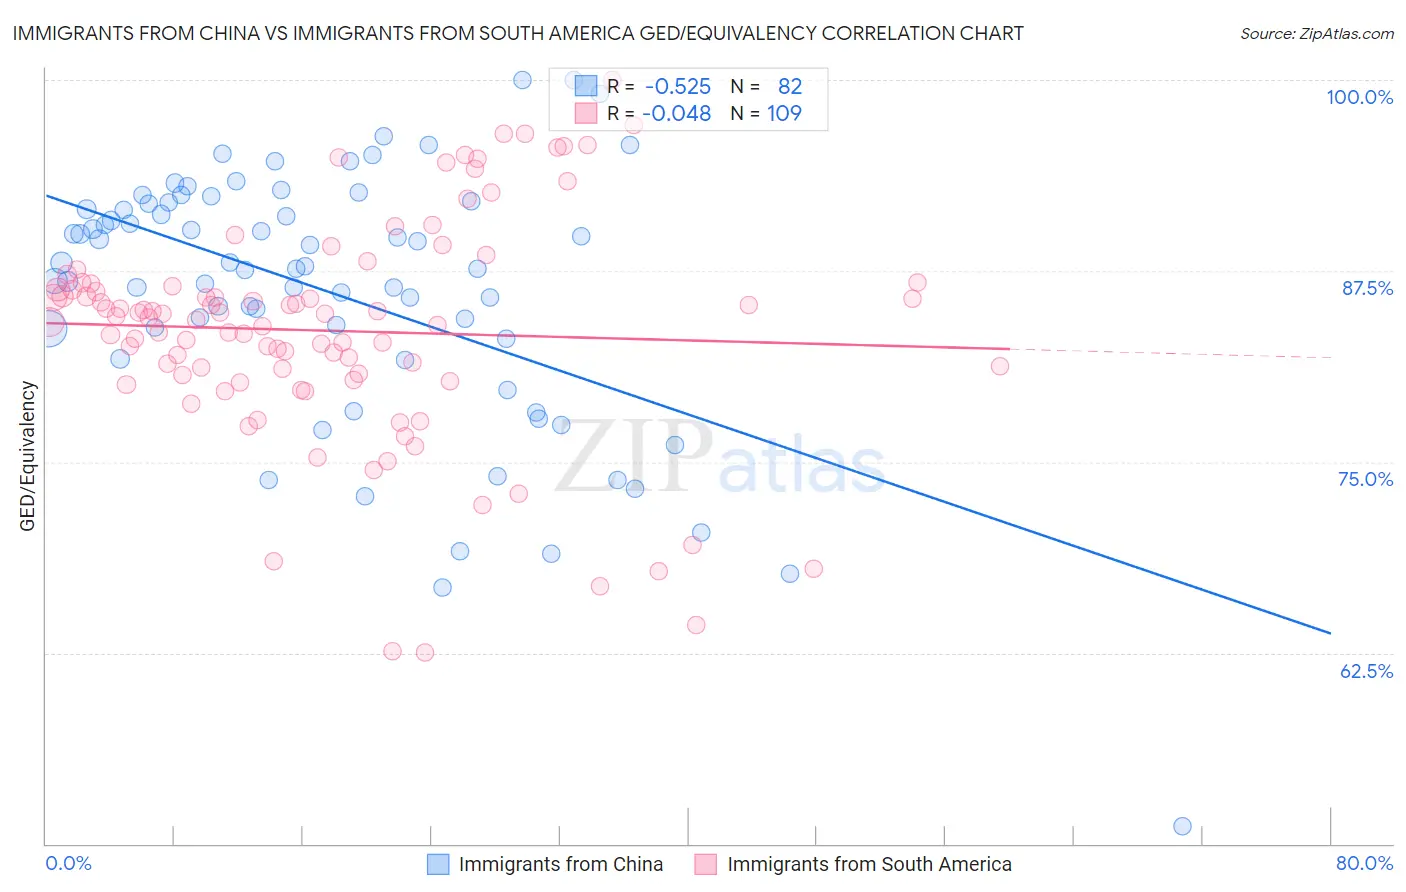
Immigrants from China vs Immigrants from South America GED/Equivalency Correlation Chart
The statistical analysis conducted on geographies consisting of 457,082,738 people shows a substantial negative correlation between the proportion of Immigrants from China and percentage of population with at least ged/equivalency education in the United States with a correlation coefficient (R) of -0.525 and weighted average of 86.9%. Similarly, the statistical analysis conducted on geographies consisting of 486,429,793 people shows no correlation between the proportion of Immigrants from South America and percentage of population with at least ged/equivalency education in the United States with a correlation coefficient (R) of -0.048 and weighted average of 84.4%, a difference of 3.0%.
GED/Equivalency Correlation Summary
| Measurement | Immigrants from China | Immigrants from South America |
| Minimum | 51.2% | 62.5% |
| Maximum | 100.0% | 100.0% |
| Range | 48.8% | 37.5% |
| Mean | 86.0% | 83.6% |
| Median | 87.7% | 84.5% |
| Interquartile 25% (IQ1) | 83.1% | 80.5% |
| Interquartile 75% (IQ3) | 91.9% | 86.6% |
| Interquartile Range (IQR) | 8.8% | 6.0% |
| Standard Deviation (Sample) | 8.6% | 7.4% |
| Standard Deviation (Population) | 8.6% | 7.3% |
Similar Demographics by GED/Equivalency
Demographics Similar to Immigrants from China by GED/Equivalency
In terms of ged/equivalency, the demographic groups most similar to Immigrants from China are French Canadian (86.9%, a difference of 0.0%), Immigrants from Hong Kong (86.9%, a difference of 0.050%), Swiss (87.0%, a difference of 0.12%), Scotch-Irish (86.8%, a difference of 0.12%), and Immigrants from Kazakhstan (87.0%, a difference of 0.13%).
| Demographics | Rating | Rank | GED/Equivalency |
| Tlingit-Haida | 94.8 /100 | #112 | Exceptional 87.0% |
| Assyrians/Chaldeans/Syriacs | 94.8 /100 | #113 | Exceptional 87.0% |
| Immigrants | Kazakhstan | 94.7 /100 | #114 | Exceptional 87.0% |
| Mongolians | 94.6 /100 | #115 | Exceptional 87.0% |
| Swiss | 94.5 /100 | #116 | Exceptional 87.0% |
| Immigrants | Hong Kong | 93.8 /100 | #117 | Exceptional 86.9% |
| French Canadians | 93.2 /100 | #118 | Exceptional 86.9% |
| Immigrants | China | 93.2 /100 | #119 | Exceptional 86.9% |
| Scotch-Irish | 91.6 /100 | #120 | Exceptional 86.8% |
| Immigrants | Lebanon | 90.9 /100 | #121 | Exceptional 86.8% |
| Immigrants | Jordan | 90.8 /100 | #122 | Exceptional 86.8% |
| Immigrants | Italy | 90.5 /100 | #123 | Exceptional 86.7% |
| Immigrants | Egypt | 90.4 /100 | #124 | Exceptional 86.7% |
| Celtics | 90.4 /100 | #125 | Exceptional 86.7% |
| Asians | 90.3 /100 | #126 | Exceptional 86.7% |
Demographics Similar to Immigrants from South America by GED/Equivalency
In terms of ged/equivalency, the demographic groups most similar to Immigrants from South America are Immigrants from Panama (84.4%, a difference of 0.010%), Immigrants from Middle Africa (84.4%, a difference of 0.020%), Immigrants from Colombia (84.4%, a difference of 0.040%), Immigrants from Uruguay (84.4%, a difference of 0.050%), and Immigrants from Nigeria (84.3%, a difference of 0.080%).
| Demographics | Rating | Rank | GED/Equivalency |
| Immigrants | Thailand | 5.8 /100 | #225 | Tragic 84.5% |
| Immigrants | Zaire | 5.5 /100 | #226 | Tragic 84.5% |
| Immigrants | Costa Rica | 5.4 /100 | #227 | Tragic 84.5% |
| Immigrants | Liberia | 4.9 /100 | #228 | Tragic 84.4% |
| Immigrants | Uruguay | 4.6 /100 | #229 | Tragic 84.4% |
| Immigrants | Colombia | 4.5 /100 | #230 | Tragic 84.4% |
| Immigrants | Middle Africa | 4.3 /100 | #231 | Tragic 84.4% |
| Immigrants | South America | 4.2 /100 | #232 | Tragic 84.4% |
| Immigrants | Panama | 4.1 /100 | #233 | Tragic 84.4% |
| Immigrants | Nigeria | 3.6 /100 | #234 | Tragic 84.3% |
| Ghanaians | 3.5 /100 | #235 | Tragic 84.3% |
| Immigrants | Eritrea | 3.5 /100 | #236 | Tragic 84.3% |
| Sub-Saharan Africans | 3.0 /100 | #237 | Tragic 84.2% |
| Immigrants | Peru | 2.7 /100 | #238 | Tragic 84.2% |
| Immigrants | Bahamas | 2.6 /100 | #239 | Tragic 84.2% |