Immigrants from Chile vs Slavic Seniors Poverty Over the Age of 65
COMPARE
Immigrants from Chile
Slavic
Seniors Poverty Over the Age of 65
Seniors Poverty Over the Age of 65 Comparison
Immigrants from Chile
Slavs
11.7%
SENIORS POVERTY OVER THE AGE OF 65
3.9/ 100
METRIC RATING
222nd/ 347
METRIC RANK
9.8%
SENIORS POVERTY OVER THE AGE OF 65
99.2/ 100
METRIC RATING
53rd/ 347
METRIC RANK
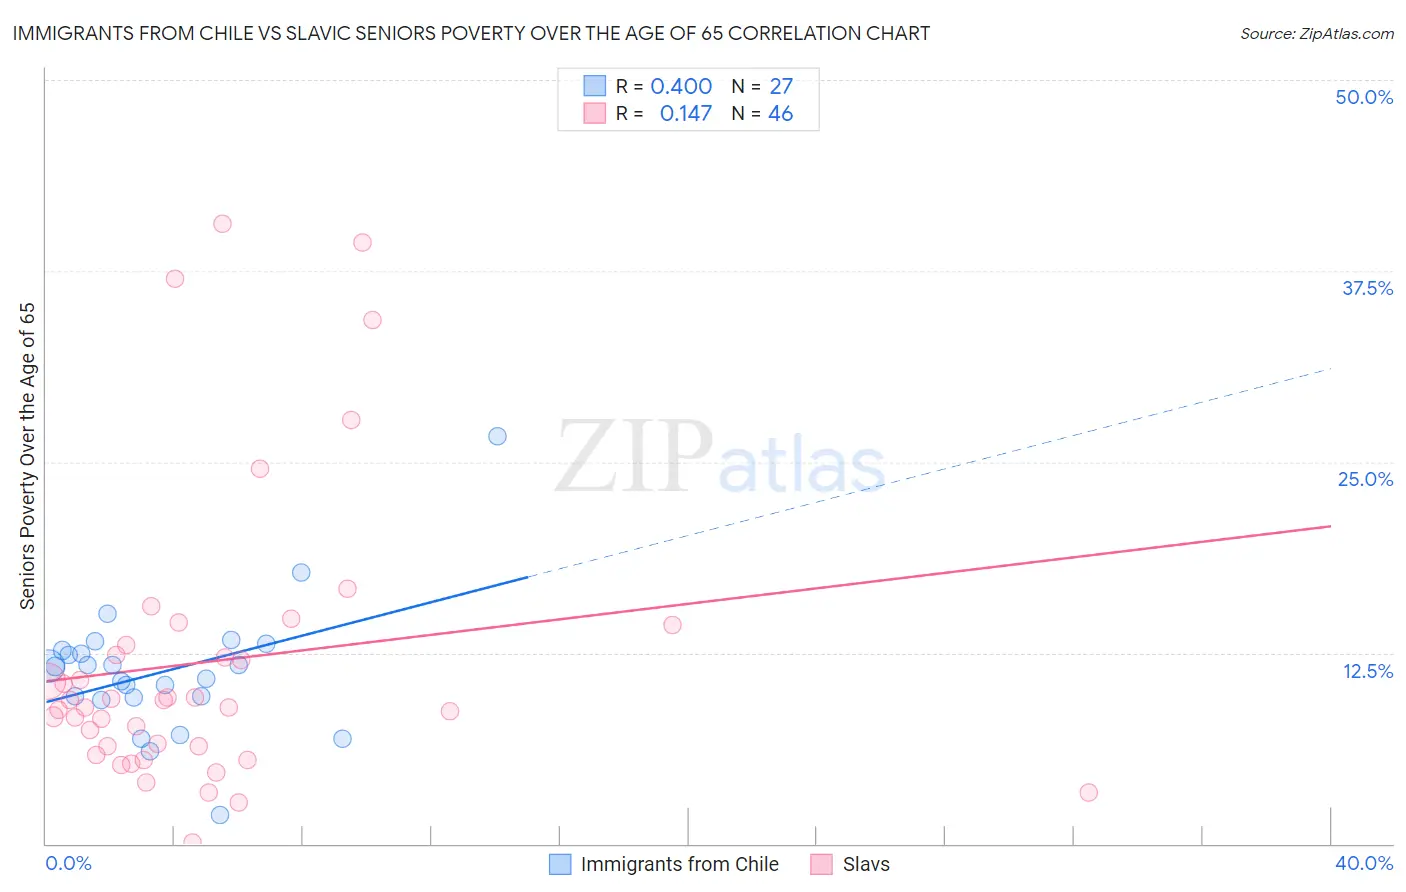
Immigrants from Chile vs Slavic Seniors Poverty Over the Age of 65 Correlation Chart
The statistical analysis conducted on geographies consisting of 218,369,529 people shows a mild positive correlation between the proportion of Immigrants from Chile and poverty level among seniors over the age of 65 in the United States with a correlation coefficient (R) of 0.400 and weighted average of 11.7%. Similarly, the statistical analysis conducted on geographies consisting of 270,346,307 people shows a poor positive correlation between the proportion of Slavs and poverty level among seniors over the age of 65 in the United States with a correlation coefficient (R) of 0.147 and weighted average of 9.8%, a difference of 20.1%.
Seniors Poverty Over the Age of 65 Correlation Summary
| Measurement | Immigrants from Chile | Slavic |
| Minimum | 1.9% | 0.12% |
| Maximum | 26.7% | 40.6% |
| Range | 24.8% | 40.4% |
| Mean | 11.3% | 11.9% |
| Median | 11.6% | 9.2% |
| Interquartile 25% (IQ1) | 9.5% | 6.4% |
| Interquartile 75% (IQ3) | 12.7% | 13.0% |
| Interquartile Range (IQR) | 3.1% | 6.6% |
| Standard Deviation (Sample) | 4.4% | 9.6% |
| Standard Deviation (Population) | 4.3% | 9.5% |
Similar Demographics by Seniors Poverty Over the Age of 65
Demographics Similar to Immigrants from Chile by Seniors Poverty Over the Age of 65
In terms of seniors poverty over the age of 65, the demographic groups most similar to Immigrants from Chile are Immigrants from Congo (11.7%, a difference of 0.040%), Argentinean (11.7%, a difference of 0.12%), Peruvian (11.7%, a difference of 0.18%), Immigrants from Nigeria (11.7%, a difference of 0.28%), and Immigrants from Belarus (11.8%, a difference of 0.38%).
| Demographics | Rating | Rank | Seniors Poverty Over the Age of 65 |
| French American Indians | 8.7 /100 | #215 | Tragic 11.5% |
| Immigrants | Morocco | 6.8 /100 | #216 | Tragic 11.6% |
| Immigrants | Africa | 6.4 /100 | #217 | Tragic 11.6% |
| Immigrants | Ukraine | 5.7 /100 | #218 | Tragic 11.6% |
| Arapaho | 5.2 /100 | #219 | Tragic 11.6% |
| Peruvians | 4.2 /100 | #220 | Tragic 11.7% |
| Argentineans | 4.1 /100 | #221 | Tragic 11.7% |
| Immigrants | Chile | 3.9 /100 | #222 | Tragic 11.7% |
| Immigrants | Congo | 3.8 /100 | #223 | Tragic 11.7% |
| Immigrants | Nigeria | 3.4 /100 | #224 | Tragic 11.7% |
| Immigrants | Belarus | 3.2 /100 | #225 | Tragic 11.8% |
| Liberians | 3.2 /100 | #226 | Tragic 11.8% |
| Nigerians | 3.2 /100 | #227 | Tragic 11.8% |
| Immigrants | Costa Rica | 2.7 /100 | #228 | Tragic 11.8% |
| Immigrants | Eritrea | 2.6 /100 | #229 | Tragic 11.8% |
Demographics Similar to Slavs by Seniors Poverty Over the Age of 65
In terms of seniors poverty over the age of 65, the demographic groups most similar to Slavs are Immigrants from Northern Europe (9.8%, a difference of 0.060%), Filipino (9.7%, a difference of 0.11%), Carpatho Rusyn (9.7%, a difference of 0.13%), Afghan (9.8%, a difference of 0.19%), and Immigrants from England (9.8%, a difference of 0.31%).
| Demographics | Rating | Rank | Seniors Poverty Over the Age of 65 |
| Immigrants | Taiwan | 99.5 /100 | #46 | Exceptional 9.7% |
| Immigrants | South Central Asia | 99.5 /100 | #47 | Exceptional 9.7% |
| French | 99.5 /100 | #48 | Exceptional 9.7% |
| Immigrants | Lithuania | 99.4 /100 | #49 | Exceptional 9.7% |
| Hungarians | 99.4 /100 | #50 | Exceptional 9.7% |
| Carpatho Rusyns | 99.3 /100 | #51 | Exceptional 9.7% |
| Filipinos | 99.3 /100 | #52 | Exceptional 9.7% |
| Slavs | 99.2 /100 | #53 | Exceptional 9.8% |
| Immigrants | Northern Europe | 99.2 /100 | #54 | Exceptional 9.8% |
| Afghans | 99.2 /100 | #55 | Exceptional 9.8% |
| Immigrants | England | 99.1 /100 | #56 | Exceptional 9.8% |
| Bolivians | 99.1 /100 | #57 | Exceptional 9.8% |
| Serbians | 99.1 /100 | #58 | Exceptional 9.8% |
| Immigrants | Canada | 99.0 /100 | #59 | Exceptional 9.8% |
| Celtics | 99.0 /100 | #60 | Exceptional 9.8% |