Immigrants from Peru vs Slavic College, 1 year or more
COMPARE
Immigrants from Peru
Slavic
College, 1 year or more
College, 1 year or more Comparison
Immigrants from Peru
Slavs
57.7%
COLLEGE, 1 YEAR OR MORE
10.6/ 100
METRIC RATING
216th/ 347
METRIC RANK
60.6%
COLLEGE, 1 YEAR OR MORE
81.1/ 100
METRIC RATING
145th/ 347
METRIC RANK
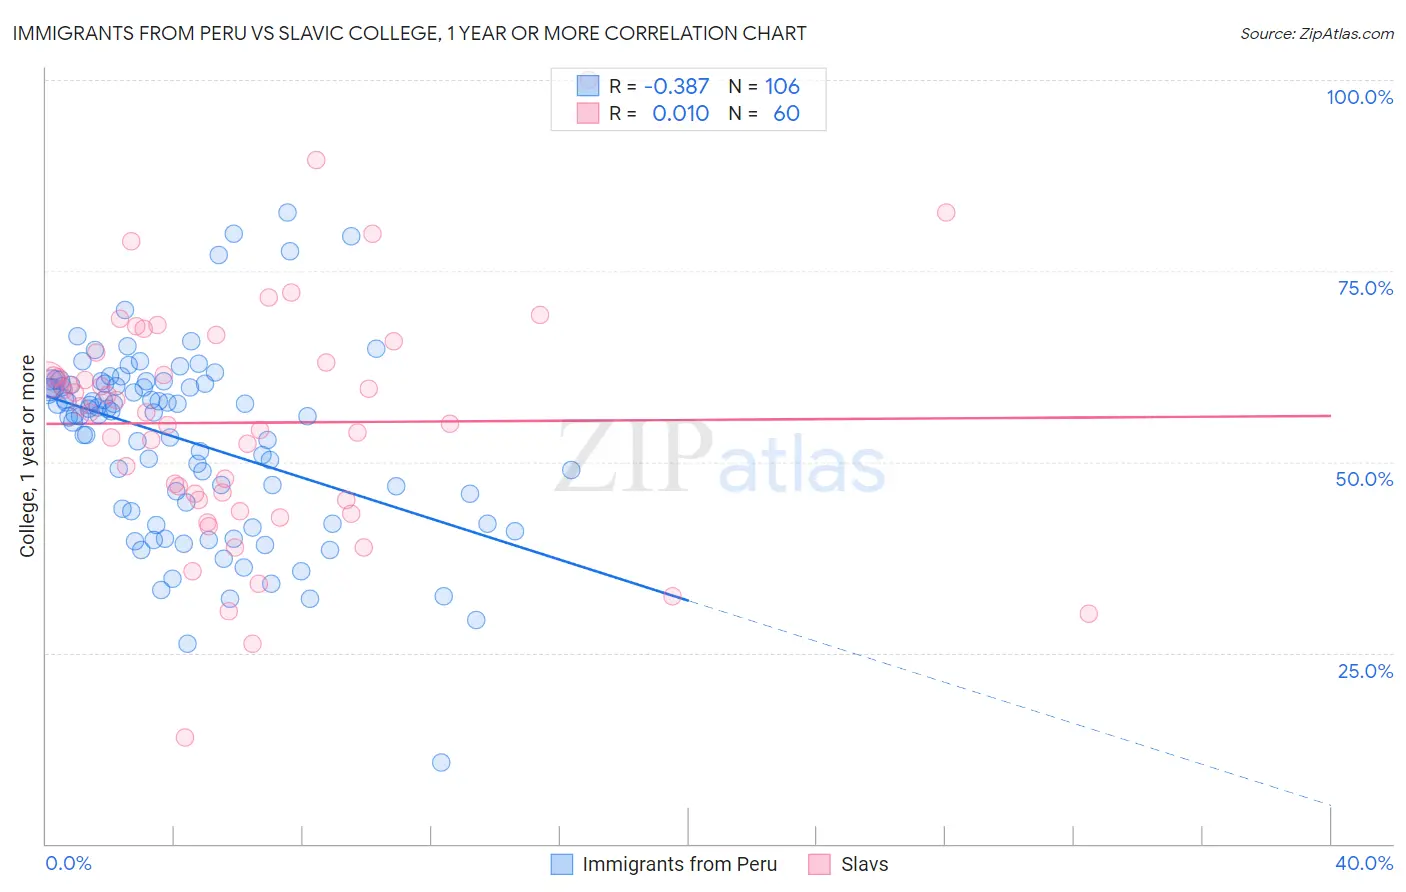
Immigrants from Peru vs Slavic College, 1 year or more Correlation Chart
The statistical analysis conducted on geographies consisting of 328,860,288 people shows a mild negative correlation between the proportion of Immigrants from Peru and percentage of population with at least college, 1 year or more education in the United States with a correlation coefficient (R) of -0.387 and weighted average of 57.7%. Similarly, the statistical analysis conducted on geographies consisting of 270,867,316 people shows no correlation between the proportion of Slavs and percentage of population with at least college, 1 year or more education in the United States with a correlation coefficient (R) of 0.010 and weighted average of 60.6%, a difference of 4.9%.
College, 1 year or more Correlation Summary
| Measurement | Immigrants from Peru | Slavic |
| Minimum | 10.6% | 14.0% |
| Maximum | 82.6% | 100.0% |
| Range | 72.0% | 86.0% |
| Mean | 52.8% | 55.1% |
| Median | 56.3% | 56.5% |
| Interquartile 25% (IQ1) | 43.5% | 45.0% |
| Interquartile 75% (IQ3) | 60.2% | 63.6% |
| Interquartile Range (IQR) | 16.7% | 18.6% |
| Standard Deviation (Sample) | 12.2% | 15.6% |
| Standard Deviation (Population) | 12.1% | 15.4% |
Similar Demographics by College, 1 year or more
Demographics Similar to Immigrants from Peru by College, 1 year or more
In terms of college, 1 year or more, the demographic groups most similar to Immigrants from Peru are Tongan (57.8%, a difference of 0.13%), Immigrants from Colombia (57.8%, a difference of 0.14%), Immigrants from Senegal (57.8%, a difference of 0.17%), French Canadian (57.8%, a difference of 0.17%), and Immigrants from Panama (57.6%, a difference of 0.24%).
| Demographics | Rating | Rank | College, 1 year or more |
| Immigrants | Middle Africa | 14.0 /100 | #209 | Poor 58.0% |
| Tsimshian | 13.5 /100 | #210 | Poor 57.9% |
| Immigrants | Nigeria | 13.3 /100 | #211 | Poor 57.9% |
| Immigrants | Senegal | 11.8 /100 | #212 | Poor 57.8% |
| French Canadians | 11.8 /100 | #213 | Poor 57.8% |
| Immigrants | Colombia | 11.6 /100 | #214 | Poor 57.8% |
| Tongans | 11.6 /100 | #215 | Poor 57.8% |
| Immigrants | Peru | 10.6 /100 | #216 | Poor 57.7% |
| Immigrants | Panama | 9.1 /100 | #217 | Tragic 57.6% |
| Native Hawaiians | 9.0 /100 | #218 | Tragic 57.6% |
| Whites/Caucasians | 8.7 /100 | #219 | Tragic 57.6% |
| Immigrants | Costa Rica | 8.0 /100 | #220 | Tragic 57.5% |
| Immigrants | Ghana | 7.7 /100 | #221 | Tragic 57.4% |
| Sub-Saharan Africans | 6.1 /100 | #222 | Tragic 57.3% |
| Portuguese | 5.4 /100 | #223 | Tragic 57.2% |
Demographics Similar to Slavs by College, 1 year or more
In terms of college, 1 year or more, the demographic groups most similar to Slavs are Czech (60.6%, a difference of 0.070%), Scottish (60.5%, a difference of 0.070%), Canadian (60.6%, a difference of 0.14%), Polish (60.7%, a difference of 0.15%), and Immigrants from Kenya (60.5%, a difference of 0.16%).
| Demographics | Rating | Rank | College, 1 year or more |
| Taiwanese | 84.3 /100 | #138 | Excellent 60.7% |
| Immigrants | Eritrea | 84.3 /100 | #139 | Excellent 60.7% |
| Iraqis | 83.3 /100 | #140 | Excellent 60.7% |
| Immigrants | Afghanistan | 83.1 /100 | #141 | Excellent 60.7% |
| Poles | 82.8 /100 | #142 | Excellent 60.7% |
| Canadians | 82.7 /100 | #143 | Excellent 60.6% |
| Czechs | 81.9 /100 | #144 | Excellent 60.6% |
| Slavs | 81.1 /100 | #145 | Excellent 60.6% |
| Scottish | 80.2 /100 | #146 | Excellent 60.5% |
| Immigrants | Kenya | 79.1 /100 | #147 | Good 60.5% |
| Kenyans | 79.0 /100 | #148 | Good 60.5% |
| Brazilians | 79.0 /100 | #149 | Good 60.5% |
| Immigrants | Sudan | 77.8 /100 | #150 | Good 60.4% |
| Albanians | 77.8 /100 | #151 | Good 60.4% |
| Immigrants | Germany | 76.1 /100 | #152 | Good 60.3% |