Immigrants from Caribbean vs Immigrants from Lithuania Median Household Income
COMPARE
Immigrants from Caribbean
Immigrants from Lithuania
Median Household Income
Median Household Income Comparison
Immigrants from Caribbean
Immigrants from Lithuania
$71,860
MEDIAN HOUSEHOLD INCOME
0.0/ 100
METRIC RATING
309th/ 347
METRIC RANK
$96,836
MEDIAN HOUSEHOLD INCOME
99.9/ 100
METRIC RATING
42nd/ 347
METRIC RANK
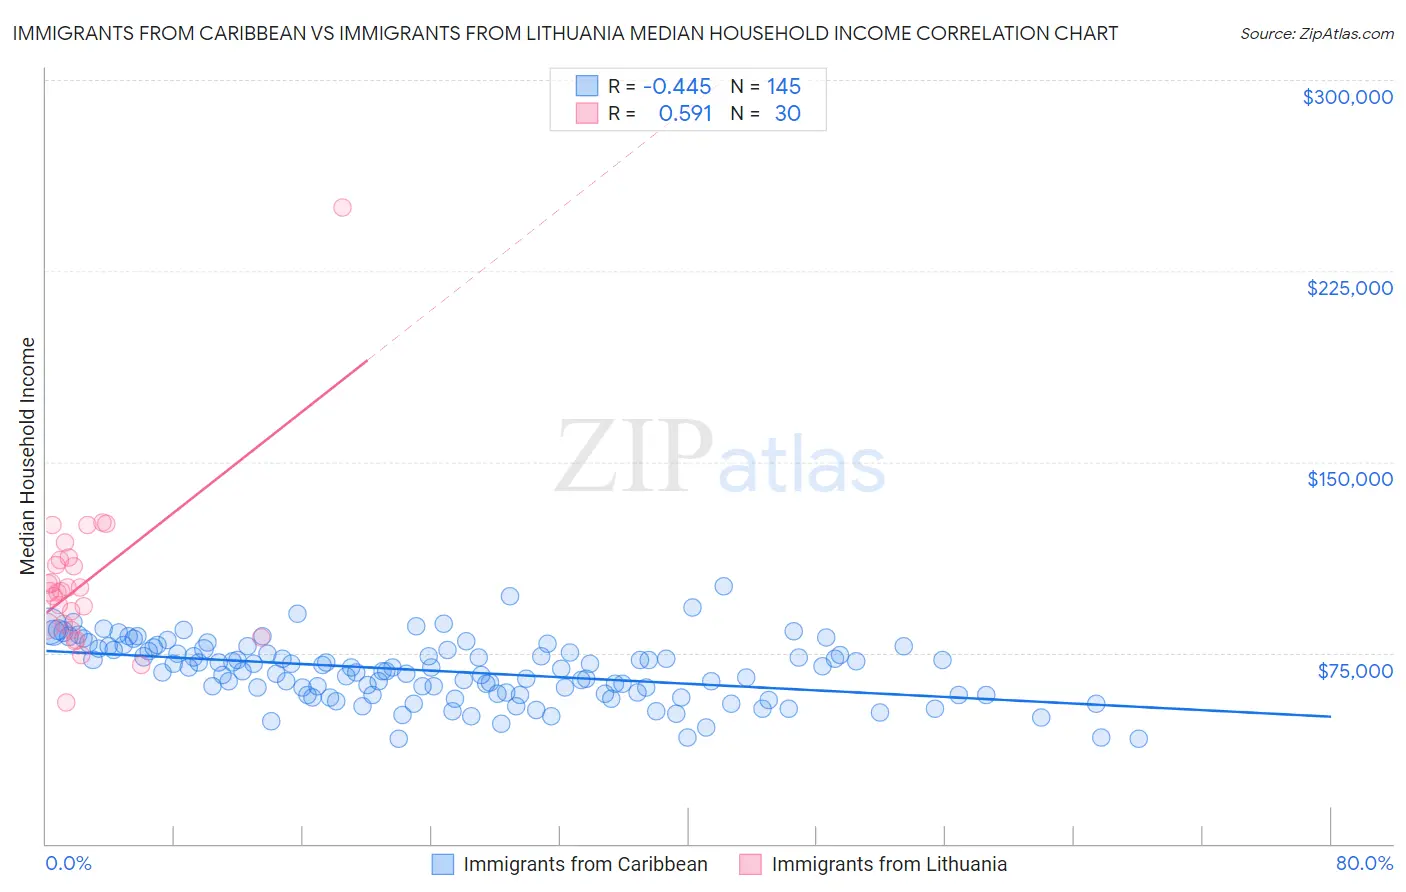
Immigrants from Caribbean vs Immigrants from Lithuania Median Household Income Correlation Chart
The statistical analysis conducted on geographies consisting of 449,492,713 people shows a moderate negative correlation between the proportion of Immigrants from Caribbean and median household income in the United States with a correlation coefficient (R) of -0.445 and weighted average of $71,860. Similarly, the statistical analysis conducted on geographies consisting of 117,713,976 people shows a substantial positive correlation between the proportion of Immigrants from Lithuania and median household income in the United States with a correlation coefficient (R) of 0.591 and weighted average of $96,836, a difference of 34.8%.
Median Household Income Correlation Summary
| Measurement | Immigrants from Caribbean | Immigrants from Lithuania |
| Minimum | $41,053 | $55,636 |
| Maximum | $101,042 | $250,001 |
| Range | $59,989 | $194,365 |
| Mean | $67,787 | $102,979 |
| Median | $68,717 | $99,018 |
| Interquartile 25% (IQ1) | $58,750 | $85,668 |
| Interquartile 75% (IQ3) | $76,359 | $111,586 |
| Interquartile Range (IQR) | $17,609 | $25,918 |
| Standard Deviation (Sample) | $11,824 | $32,780 |
| Standard Deviation (Population) | $11,783 | $32,229 |
Similar Demographics by Median Household Income
Demographics Similar to Immigrants from Caribbean by Median Household Income
In terms of median household income, the demographic groups most similar to Immigrants from Caribbean are U.S. Virgin Islander ($71,853, a difference of 0.010%), Immigrants from Zaire ($71,801, a difference of 0.080%), Yakama ($72,225, a difference of 0.51%), Immigrants from Honduras ($71,452, a difference of 0.57%), and Immigrants from Bahamas ($71,349, a difference of 0.72%).
| Demographics | Rating | Rank | Median Household Income |
| Shoshone | 0.0 /100 | #302 | Tragic $72,660 |
| Africans | 0.0 /100 | #303 | Tragic $72,650 |
| Immigrants | Haiti | 0.0 /100 | #304 | Tragic $72,599 |
| Hondurans | 0.0 /100 | #305 | Tragic $72,588 |
| Potawatomi | 0.0 /100 | #306 | Tragic $72,576 |
| Ute | 0.0 /100 | #307 | Tragic $72,402 |
| Yakama | 0.0 /100 | #308 | Tragic $72,225 |
| Immigrants | Caribbean | 0.0 /100 | #309 | Tragic $71,860 |
| U.S. Virgin Islanders | 0.0 /100 | #310 | Tragic $71,853 |
| Immigrants | Zaire | 0.0 /100 | #311 | Tragic $71,801 |
| Immigrants | Honduras | 0.0 /100 | #312 | Tragic $71,452 |
| Immigrants | Bahamas | 0.0 /100 | #313 | Tragic $71,349 |
| Dominicans | 0.0 /100 | #314 | Tragic $71,302 |
| Ottawa | 0.0 /100 | #315 | Tragic $70,984 |
| Apache | 0.0 /100 | #316 | Tragic $70,927 |
Demographics Similar to Immigrants from Lithuania by Median Household Income
In terms of median household income, the demographic groups most similar to Immigrants from Lithuania are Immigrants from France ($96,743, a difference of 0.10%), Immigrants from Turkey ($96,964, a difference of 0.13%), Immigrants from Greece ($96,675, a difference of 0.17%), Maltese ($97,015, a difference of 0.18%), and Afghan ($97,026, a difference of 0.20%).
| Demographics | Rating | Rank | Median Household Income |
| Immigrants | Switzerland | 100.0 /100 | #35 | Exceptional $97,979 |
| Immigrants | Pakistan | 100.0 /100 | #36 | Exceptional $97,528 |
| Latvians | 100.0 /100 | #37 | Exceptional $97,311 |
| Immigrants | Indonesia | 100.0 /100 | #38 | Exceptional $97,297 |
| Afghans | 100.0 /100 | #39 | Exceptional $97,026 |
| Maltese | 100.0 /100 | #40 | Exceptional $97,015 |
| Immigrants | Turkey | 100.0 /100 | #41 | Exceptional $96,964 |
| Immigrants | Lithuania | 99.9 /100 | #42 | Exceptional $96,836 |
| Immigrants | France | 99.9 /100 | #43 | Exceptional $96,743 |
| Immigrants | Greece | 99.9 /100 | #44 | Exceptional $96,675 |
| Israelis | 99.9 /100 | #45 | Exceptional $96,552 |
| Australians | 99.9 /100 | #46 | Exceptional $96,490 |
| Immigrants | Russia | 99.9 /100 | #47 | Exceptional $96,378 |
| Cambodians | 99.9 /100 | #48 | Exceptional $96,324 |
| Immigrants | Malaysia | 99.9 /100 | #49 | Exceptional $96,292 |