Immigrants from Cambodia vs Somali Per Capita Income
COMPARE
Immigrants from Cambodia
Somali
Per Capita Income
Per Capita Income Comparison
Immigrants from Cambodia
Somalis
$40,434
PER CAPITA INCOME
2.6/ 100
METRIC RATING
237th/ 347
METRIC RANK
$40,367
PER CAPITA INCOME
2.4/ 100
METRIC RATING
238th/ 347
METRIC RANK
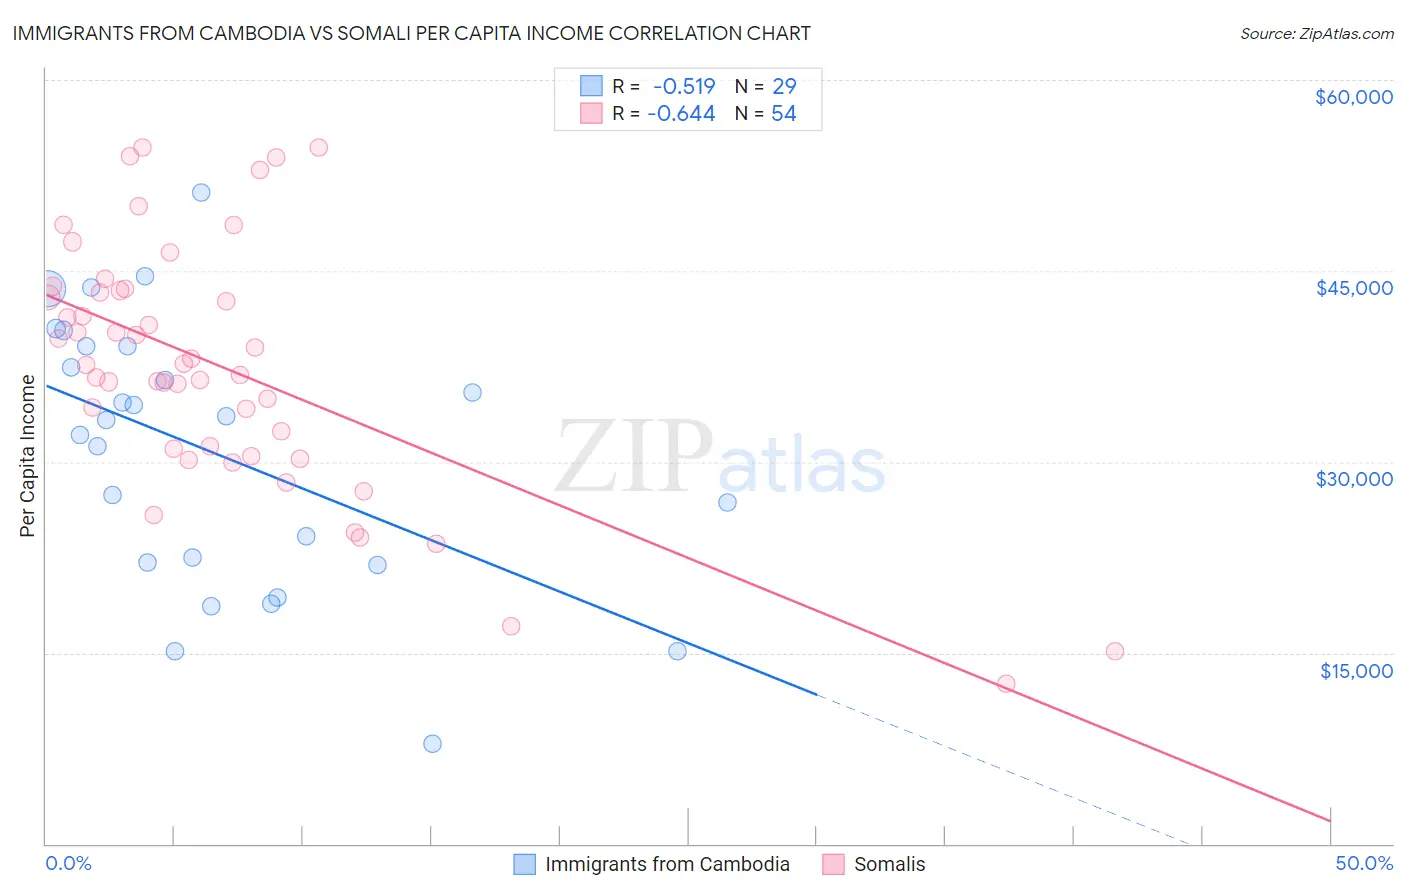
Immigrants from Cambodia vs Somali Per Capita Income Correlation Chart
The statistical analysis conducted on geographies consisting of 205,159,034 people shows a substantial negative correlation between the proportion of Immigrants from Cambodia and per capita income in the United States with a correlation coefficient (R) of -0.519 and weighted average of $40,434. Similarly, the statistical analysis conducted on geographies consisting of 99,334,522 people shows a significant negative correlation between the proportion of Somalis and per capita income in the United States with a correlation coefficient (R) of -0.644 and weighted average of $40,367, a difference of 0.16%.
Per Capita Income Correlation Summary
| Measurement | Immigrants from Cambodia | Somali |
| Minimum | $7,849 | $12,576 |
| Maximum | $51,157 | $54,740 |
| Range | $43,308 | $42,164 |
| Mean | $30,701 | $37,481 |
| Median | $33,314 | $37,654 |
| Interquartile 25% (IQ1) | $21,996 | $31,050 |
| Interquartile 75% (IQ3) | $39,085 | $43,455 |
| Interquartile Range (IQR) | $17,089 | $12,404 |
| Standard Deviation (Sample) | $10,577 | $9,737 |
| Standard Deviation (Population) | $10,393 | $9,647 |
Demographics Similar to Immigrants from Cambodia and Somalis by Per Capita Income
In terms of per capita income, the demographic groups most similar to Immigrants from Cambodia are Tsimshian ($40,344, a difference of 0.22%), Immigrants from Nigeria ($40,339, a difference of 0.24%), British West Indian ($40,330, a difference of 0.26%), Immigrants from Western Africa ($40,294, a difference of 0.35%), and German Russian ($40,266, a difference of 0.42%). Similarly, the demographic groups most similar to Somalis are Tsimshian ($40,344, a difference of 0.060%), Immigrants from Nigeria ($40,339, a difference of 0.070%), British West Indian ($40,330, a difference of 0.090%), Immigrants from Western Africa ($40,294, a difference of 0.18%), and German Russian ($40,266, a difference of 0.25%).
| Demographics | Rating | Rank | Per Capita Income |
| Immigrants | Ghana | 5.5 /100 | #227 | Tragic $41,131 |
| Immigrants | Grenada | 5.5 /100 | #228 | Tragic $41,123 |
| Nigerians | 4.9 /100 | #229 | Tragic $41,026 |
| Native Hawaiians | 4.9 /100 | #230 | Tragic $41,017 |
| Senegalese | 4.8 /100 | #231 | Tragic $41,000 |
| Guyanese | 4.5 /100 | #232 | Tragic $40,949 |
| Delaware | 3.8 /100 | #233 | Tragic $40,778 |
| Immigrants | West Indies | 3.7 /100 | #234 | Tragic $40,763 |
| Immigrants | Guyana | 3.6 /100 | #235 | Tragic $40,742 |
| Immigrants | Nonimmigrants | 3.4 /100 | #236 | Tragic $40,669 |
| Immigrants | Cambodia | 2.6 /100 | #237 | Tragic $40,434 |
| Somalis | 2.4 /100 | #238 | Tragic $40,367 |
| Tsimshian | 2.4 /100 | #239 | Tragic $40,344 |
| Immigrants | Nigeria | 2.3 /100 | #240 | Tragic $40,339 |
| British West Indians | 2.3 /100 | #241 | Tragic $40,330 |
| Immigrants | Western Africa | 2.2 /100 | #242 | Tragic $40,294 |
| German Russians | 2.2 /100 | #243 | Tragic $40,266 |
| French American Indians | 2.1 /100 | #244 | Tragic $40,244 |
| Sub-Saharan Africans | 1.9 /100 | #245 | Tragic $40,152 |
| Cree | 1.7 /100 | #246 | Tragic $40,056 |
| Immigrants | Somalia | 1.6 /100 | #247 | Tragic $39,974 |