Immigrants from Cambodia vs Somali 1st Grade
COMPARE
Immigrants from Cambodia
Somali
1st Grade
1st Grade Comparison
Immigrants from Cambodia
Somalis
96.5%
1ST GRADE
0.0/ 100
METRIC RATING
337th/ 347
METRIC RANK
97.0%
1ST GRADE
0.0/ 100
METRIC RATING
303rd/ 347
METRIC RANK
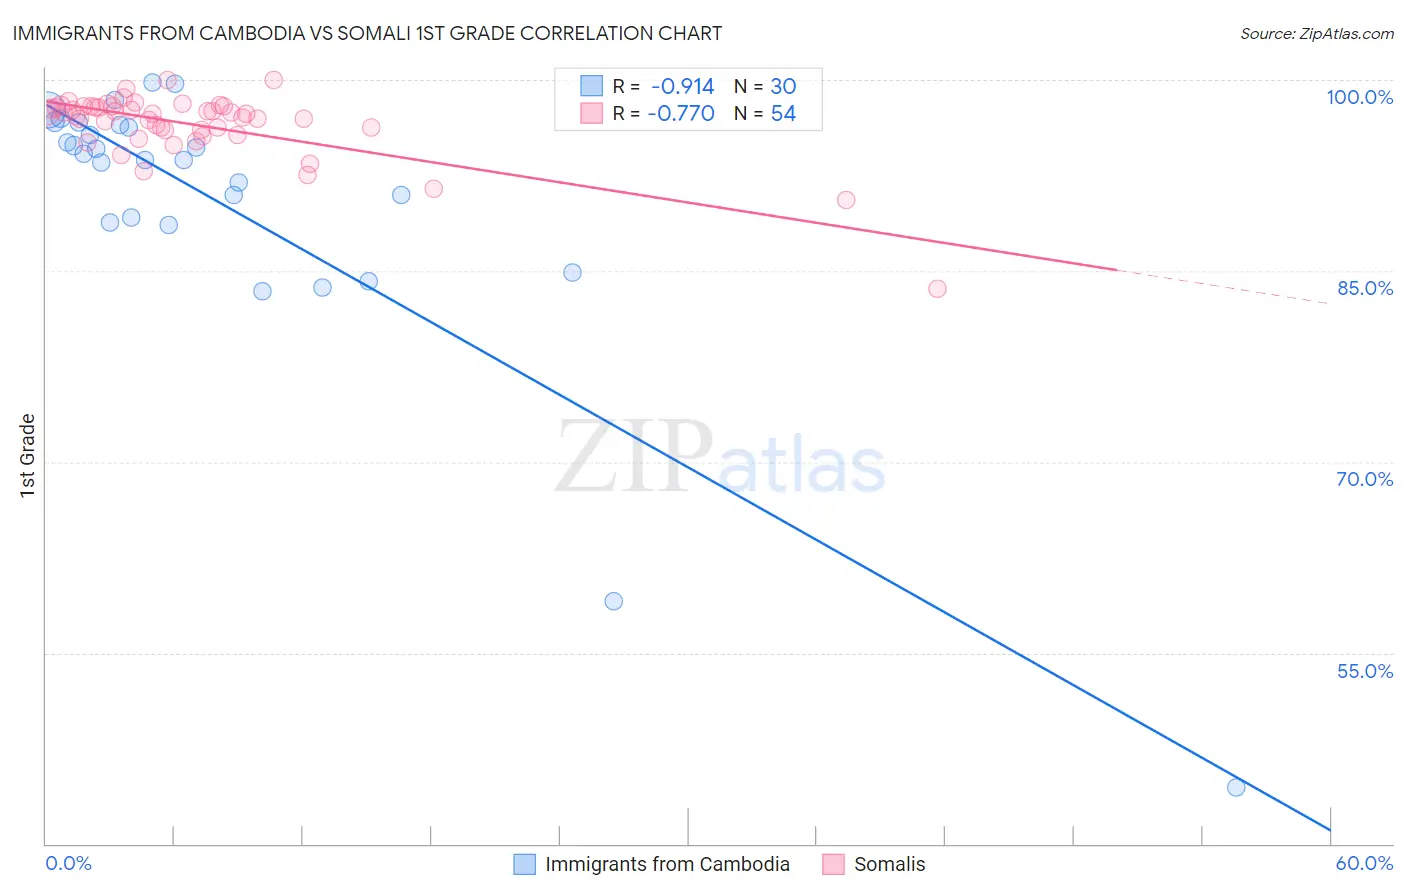
Immigrants from Cambodia vs Somali 1st Grade Correlation Chart
The statistical analysis conducted on geographies consisting of 205,153,442 people shows a near-perfect negative correlation between the proportion of Immigrants from Cambodia and percentage of population with at least 1st grade education in the United States with a correlation coefficient (R) of -0.914 and weighted average of 96.5%. Similarly, the statistical analysis conducted on geographies consisting of 99,332,457 people shows a strong negative correlation between the proportion of Somalis and percentage of population with at least 1st grade education in the United States with a correlation coefficient (R) of -0.770 and weighted average of 97.0%, a difference of 0.58%.
1st Grade Correlation Summary
| Measurement | Immigrants from Cambodia | Somali |
| Minimum | 44.4% | 83.6% |
| Maximum | 99.8% | 100.0% |
| Range | 55.4% | 16.4% |
| Mean | 90.3% | 96.5% |
| Median | 94.0% | 97.3% |
| Interquartile 25% (IQ1) | 88.8% | 96.0% |
| Interquartile 75% (IQ3) | 96.5% | 97.9% |
| Interquartile Range (IQR) | 7.7% | 1.9% |
| Standard Deviation (Sample) | 11.6% | 2.6% |
| Standard Deviation (Population) | 11.4% | 2.6% |
Similar Demographics by 1st Grade
Demographics Similar to Immigrants from Cambodia by 1st Grade
In terms of 1st grade, the demographic groups most similar to Immigrants from Cambodia are Immigrants from Fiji (96.4%, a difference of 0.020%), Guatemalan (96.5%, a difference of 0.040%), Yakama (96.5%, a difference of 0.060%), Immigrants from Dominican Republic (96.5%, a difference of 0.080%), and Bangladeshi (96.5%, a difference of 0.080%).
| Demographics | Rating | Rank | 1st Grade |
| Immigrants | Vietnam | 0.0 /100 | #330 | Tragic 96.6% |
| Immigrants | Armenia | 0.0 /100 | #331 | Tragic 96.6% |
| Central Americans | 0.0 /100 | #332 | Tragic 96.5% |
| Immigrants | Dominican Republic | 0.0 /100 | #333 | Tragic 96.5% |
| Bangladeshis | 0.0 /100 | #334 | Tragic 96.5% |
| Yakama | 0.0 /100 | #335 | Tragic 96.5% |
| Guatemalans | 0.0 /100 | #336 | Tragic 96.5% |
| Immigrants | Cambodia | 0.0 /100 | #337 | Tragic 96.5% |
| Immigrants | Fiji | 0.0 /100 | #338 | Tragic 96.4% |
| Immigrants | Guatemala | 0.0 /100 | #339 | Tragic 96.4% |
| Immigrants | Cabo Verde | 0.0 /100 | #340 | Tragic 96.3% |
| Immigrants | Central America | 0.0 /100 | #341 | Tragic 96.3% |
| Immigrants | Mexico | 0.0 /100 | #342 | Tragic 96.3% |
| Salvadorans | 0.0 /100 | #343 | Tragic 96.3% |
| Nepalese | 0.0 /100 | #344 | Tragic 96.1% |
Demographics Similar to Somalis by 1st Grade
In terms of 1st grade, the demographic groups most similar to Somalis are Nicaraguan (97.0%, a difference of 0.020%), Ecuadorian (97.0%, a difference of 0.020%), Immigrants from Caribbean (97.0%, a difference of 0.030%), Immigrants from South Eastern Asia (97.1%, a difference of 0.050%), and Belizean (96.9%, a difference of 0.070%).
| Demographics | Rating | Rank | 1st Grade |
| Immigrants | Eritrea | 0.0 /100 | #296 | Tragic 97.2% |
| Central American Indians | 0.0 /100 | #297 | Tragic 97.1% |
| Immigrants | Dominica | 0.0 /100 | #298 | Tragic 97.1% |
| Immigrants | Cuba | 0.0 /100 | #299 | Tragic 97.1% |
| Haitians | 0.0 /100 | #300 | Tragic 97.1% |
| Immigrants | South Eastern Asia | 0.0 /100 | #301 | Tragic 97.1% |
| Immigrants | Caribbean | 0.0 /100 | #302 | Tragic 97.0% |
| Somalis | 0.0 /100 | #303 | Tragic 97.0% |
| Nicaraguans | 0.0 /100 | #304 | Tragic 97.0% |
| Ecuadorians | 0.0 /100 | #305 | Tragic 97.0% |
| Belizeans | 0.0 /100 | #306 | Tragic 96.9% |
| Immigrants | Somalia | 0.0 /100 | #307 | Tragic 96.9% |
| Hispanics or Latinos | 0.0 /100 | #308 | Tragic 96.9% |
| Immigrants | Haiti | 0.0 /100 | #309 | Tragic 96.9% |
| Immigrants | Azores | 0.0 /100 | #310 | Tragic 96.9% |