Immigrants from Cambodia vs Somali Cognitive Disability
COMPARE
Immigrants from Cambodia
Somali
Cognitive Disability
Cognitive Disability Comparison
Immigrants from Cambodia
Somalis
18.1%
COGNITIVE DISABILITY
0.1/ 100
METRIC RATING
282nd/ 347
METRIC RANK
19.8%
COGNITIVE DISABILITY
0.0/ 100
METRIC RATING
345th/ 347
METRIC RANK
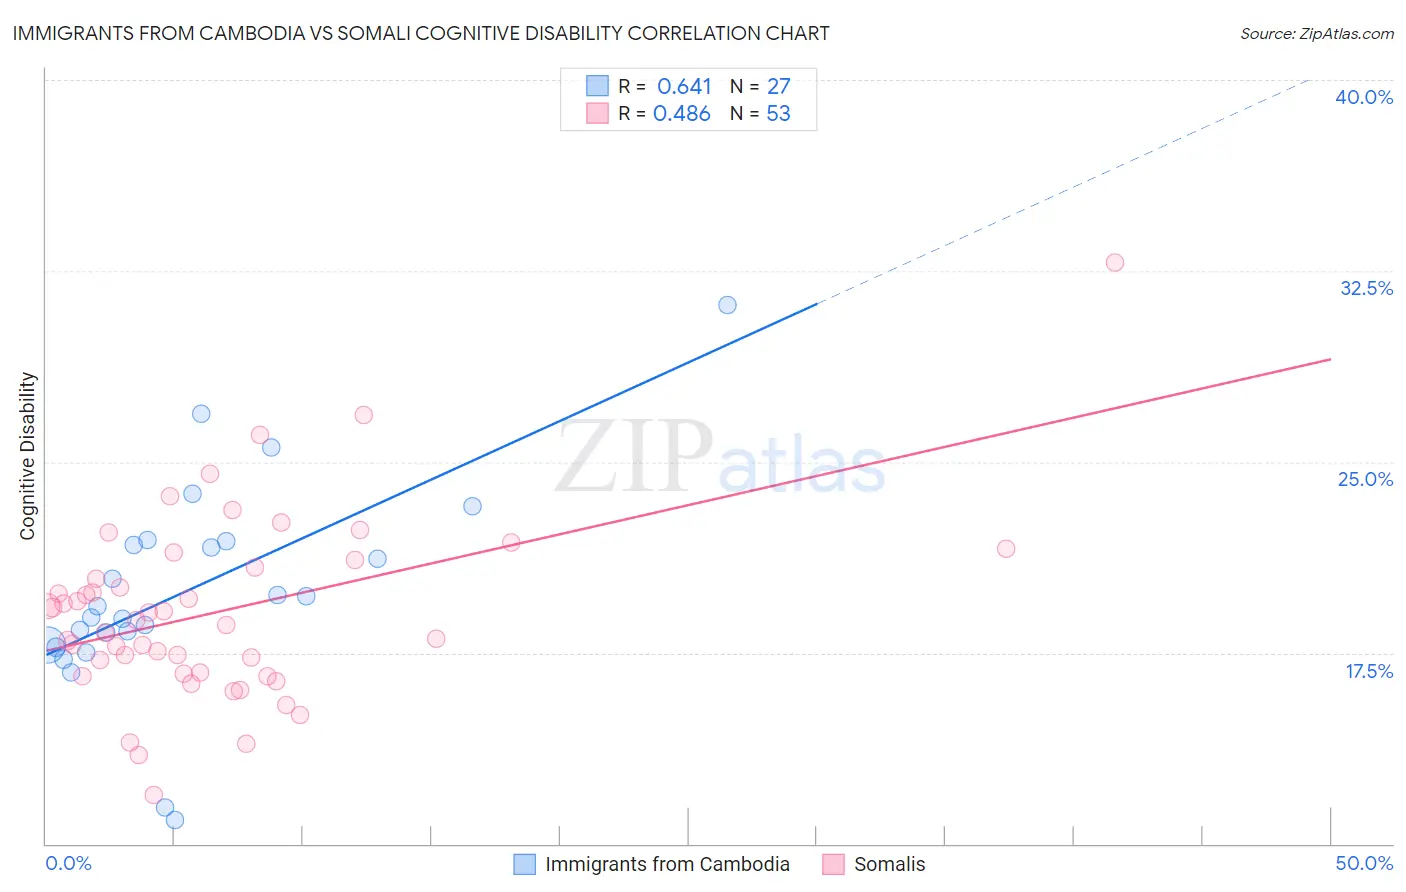
Immigrants from Cambodia vs Somali Cognitive Disability Correlation Chart
The statistical analysis conducted on geographies consisting of 205,155,269 people shows a significant positive correlation between the proportion of Immigrants from Cambodia and percentage of population with cognitive disability in the United States with a correlation coefficient (R) of 0.641 and weighted average of 18.1%. Similarly, the statistical analysis conducted on geographies consisting of 99,318,466 people shows a moderate positive correlation between the proportion of Somalis and percentage of population with cognitive disability in the United States with a correlation coefficient (R) of 0.486 and weighted average of 19.8%, a difference of 9.5%.
Cognitive Disability Correlation Summary
| Measurement | Immigrants from Cambodia | Somali |
| Minimum | 10.9% | 11.9% |
| Maximum | 31.2% | 32.8% |
| Range | 20.2% | 20.9% |
| Mean | 20.0% | 19.1% |
| Median | 19.3% | 18.8% |
| Interquartile 25% (IQ1) | 17.8% | 16.7% |
| Interquartile 75% (IQ3) | 21.9% | 21.0% |
| Interquartile Range (IQR) | 4.1% | 4.3% |
| Standard Deviation (Sample) | 4.1% | 3.6% |
| Standard Deviation (Population) | 4.1% | 3.6% |
Similar Demographics by Cognitive Disability
Demographics Similar to Immigrants from Cambodia by Cognitive Disability
In terms of cognitive disability, the demographic groups most similar to Immigrants from Cambodia are Yakama (18.1%, a difference of 0.020%), Nigerian (18.1%, a difference of 0.020%), Immigrants from Uganda (18.1%, a difference of 0.060%), Bermudan (18.1%, a difference of 0.080%), and Kenyan (18.1%, a difference of 0.11%).
| Demographics | Rating | Rank | Cognitive Disability |
| Immigrants | Laos | 0.2 /100 | #275 | Tragic 18.1% |
| Yuman | 0.2 /100 | #276 | Tragic 18.1% |
| Immigrants | Kuwait | 0.2 /100 | #277 | Tragic 18.1% |
| Immigrants | Micronesia | 0.2 /100 | #278 | Tragic 18.1% |
| Chippewa | 0.1 /100 | #279 | Tragic 18.1% |
| West Indians | 0.1 /100 | #280 | Tragic 18.1% |
| Yakama | 0.1 /100 | #281 | Tragic 18.1% |
| Immigrants | Cambodia | 0.1 /100 | #282 | Tragic 18.1% |
| Nigerians | 0.1 /100 | #283 | Tragic 18.1% |
| Immigrants | Uganda | 0.1 /100 | #284 | Tragic 18.1% |
| Bermudans | 0.1 /100 | #285 | Tragic 18.1% |
| Kenyans | 0.1 /100 | #286 | Tragic 18.1% |
| Dutch West Indians | 0.1 /100 | #287 | Tragic 18.1% |
| Immigrants | West Indies | 0.1 /100 | #288 | Tragic 18.1% |
| Natives/Alaskans | 0.1 /100 | #289 | Tragic 18.1% |
Demographics Similar to Somalis by Cognitive Disability
In terms of cognitive disability, the demographic groups most similar to Somalis are Immigrants from Cabo Verde (19.9%, a difference of 0.16%), Immigrants from Congo (19.7%, a difference of 0.56%), Immigrants from Somalia (20.0%, a difference of 0.89%), Immigrants from Zaire (19.4%, a difference of 2.2%), and Tohono O'odham (19.3%, a difference of 2.9%).
| Demographics | Rating | Rank | Cognitive Disability |
| Immigrants | Yemen | 0.0 /100 | #333 | Tragic 18.8% |
| Sudanese | 0.0 /100 | #334 | Tragic 18.9% |
| Senegalese | 0.0 /100 | #335 | Tragic 19.0% |
| Blacks/African Americans | 0.0 /100 | #336 | Tragic 19.0% |
| Immigrants | Saudi Arabia | 0.0 /100 | #337 | Tragic 19.1% |
| Lumbee | 0.0 /100 | #338 | Tragic 19.1% |
| Puerto Ricans | 0.0 /100 | #339 | Tragic 19.2% |
| Cape Verdeans | 0.0 /100 | #340 | Tragic 19.2% |
| Tohono O'odham | 0.0 /100 | #341 | Tragic 19.3% |
| Houma | 0.0 /100 | #342 | Tragic 19.3% |
| Immigrants | Zaire | 0.0 /100 | #343 | Tragic 19.4% |
| Immigrants | Congo | 0.0 /100 | #344 | Tragic 19.7% |
| Somalis | 0.0 /100 | #345 | Tragic 19.8% |
| Immigrants | Cabo Verde | 0.0 /100 | #346 | Tragic 19.9% |
| Immigrants | Somalia | 0.0 /100 | #347 | Tragic 20.0% |