Immigrants from Ghana vs Somali College, Under 1 year
COMPARE
Immigrants from Ghana
Somali
College, Under 1 year
College, Under 1 year Comparison
Immigrants from Ghana
Somalis
63.1%
COLLEGE, UNDER 1 YEAR
3.7/ 100
METRIC RATING
227th/ 347
METRIC RANK
65.8%
COLLEGE, UNDER 1 YEAR
62.7/ 100
METRIC RATING
163rd/ 347
METRIC RANK
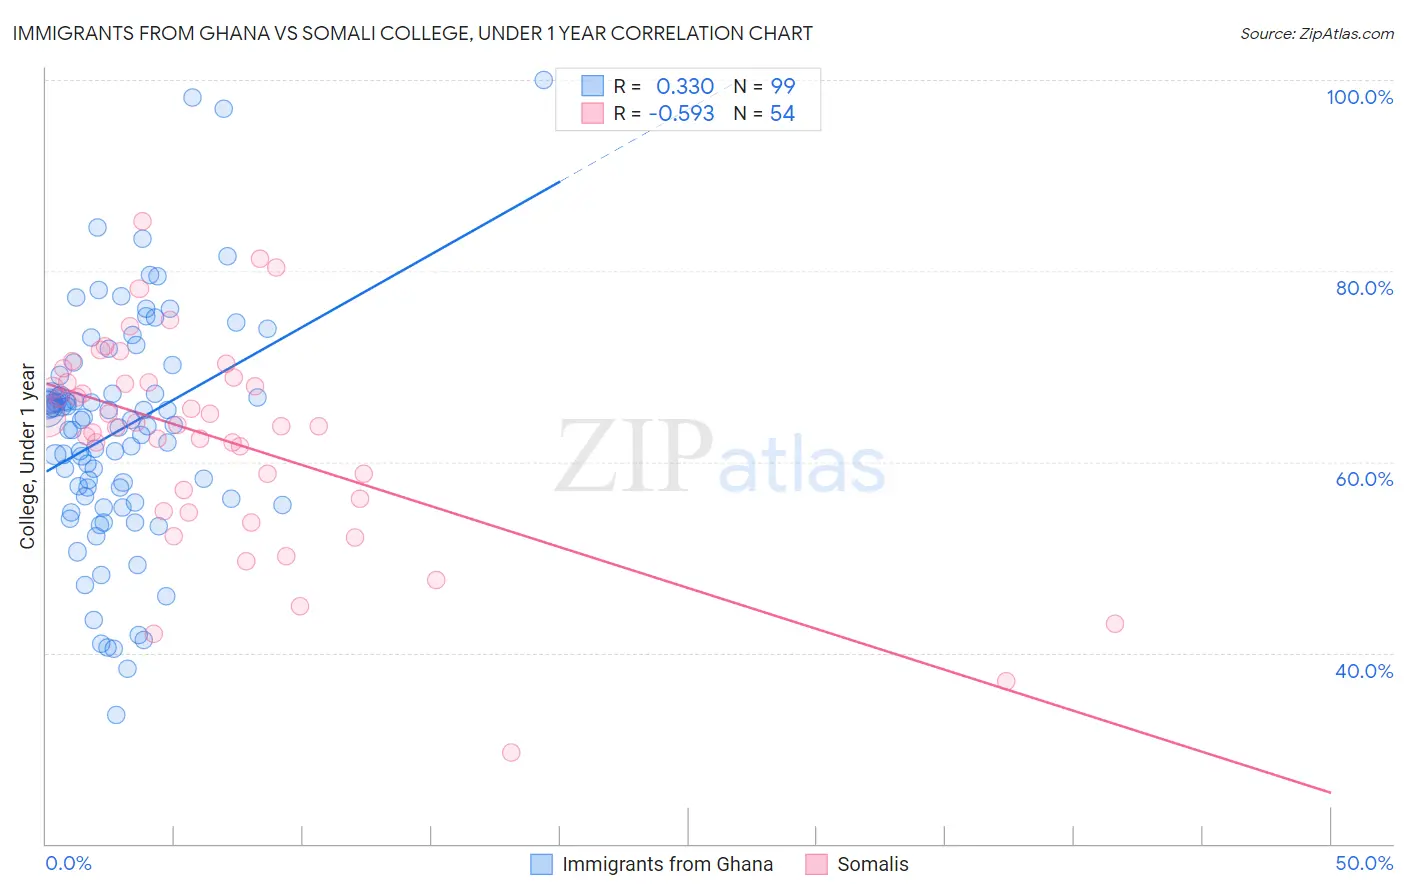
Immigrants from Ghana vs Somali College, Under 1 year Correlation Chart
The statistical analysis conducted on geographies consisting of 199,951,982 people shows a mild positive correlation between the proportion of Immigrants from Ghana and percentage of population with at least college, under 1 year education in the United States with a correlation coefficient (R) of 0.330 and weighted average of 63.1%. Similarly, the statistical analysis conducted on geographies consisting of 99,332,457 people shows a substantial negative correlation between the proportion of Somalis and percentage of population with at least college, under 1 year education in the United States with a correlation coefficient (R) of -0.593 and weighted average of 65.8%, a difference of 4.3%.
College, Under 1 year Correlation Summary
| Measurement | Immigrants from Ghana | Somali |
| Minimum | 33.5% | 29.5% |
| Maximum | 100.0% | 85.2% |
| Range | 66.5% | 55.6% |
| Mean | 63.3% | 62.4% |
| Median | 64.4% | 63.8% |
| Interquartile 25% (IQ1) | 56.1% | 56.1% |
| Interquartile 75% (IQ3) | 67.3% | 68.3% |
| Interquartile Range (IQR) | 11.2% | 12.2% |
| Standard Deviation (Sample) | 12.1% | 10.9% |
| Standard Deviation (Population) | 12.1% | 10.8% |
Similar Demographics by College, Under 1 year
Demographics Similar to Immigrants from Ghana by College, Under 1 year
In terms of college, under 1 year, the demographic groups most similar to Immigrants from Ghana are Immigrants from Colombia (63.1%, a difference of 0.090%), Immigrants from Peru (63.1%, a difference of 0.11%), Samoan (63.0%, a difference of 0.11%), Liberian (63.0%, a difference of 0.17%), and Subsaharan African (63.2%, a difference of 0.21%).
| Demographics | Rating | Rank | College, Under 1 year |
| Portuguese | 5.6 /100 | #220 | Tragic 63.4% |
| Cree | 5.2 /100 | #221 | Tragic 63.3% |
| Immigrants | Senegal | 5.0 /100 | #222 | Tragic 63.3% |
| Immigrants | Costa Rica | 4.5 /100 | #223 | Tragic 63.2% |
| Sub-Saharan Africans | 4.4 /100 | #224 | Tragic 63.2% |
| Immigrants | Peru | 4.0 /100 | #225 | Tragic 63.1% |
| Immigrants | Colombia | 4.0 /100 | #226 | Tragic 63.1% |
| Immigrants | Ghana | 3.7 /100 | #227 | Tragic 63.1% |
| Samoans | 3.3 /100 | #228 | Tragic 63.0% |
| Liberians | 3.2 /100 | #229 | Tragic 63.0% |
| Immigrants | Nonimmigrants | 3.0 /100 | #230 | Tragic 62.9% |
| Immigrants | Western Africa | 2.4 /100 | #231 | Tragic 62.8% |
| Osage | 2.2 /100 | #232 | Tragic 62.7% |
| Iroquois | 2.0 /100 | #233 | Tragic 62.6% |
| Chippewa | 2.0 /100 | #234 | Tragic 62.6% |
Demographics Similar to Somalis by College, Under 1 year
In terms of college, under 1 year, the demographic groups most similar to Somalis are Czechoslovakian (65.8%, a difference of 0.010%), Immigrants from Uzbekistan (65.8%, a difference of 0.050%), Korean (65.9%, a difference of 0.12%), Albanian (65.9%, a difference of 0.16%), and Brazilian (65.9%, a difference of 0.16%).
| Demographics | Rating | Rank | College, Under 1 year |
| Welsh | 69.9 /100 | #156 | Good 66.0% |
| Sierra Leoneans | 67.8 /100 | #157 | Good 66.0% |
| Celtics | 67.3 /100 | #158 | Good 65.9% |
| Tlingit-Haida | 66.4 /100 | #159 | Good 65.9% |
| Albanians | 66.1 /100 | #160 | Good 65.9% |
| Brazilians | 66.0 /100 | #161 | Good 65.9% |
| Koreans | 65.3 /100 | #162 | Good 65.9% |
| Somalis | 62.7 /100 | #163 | Good 65.8% |
| Czechoslovakians | 62.6 /100 | #164 | Good 65.8% |
| Immigrants | Uzbekistan | 61.6 /100 | #165 | Good 65.8% |
| Moroccans | 56.7 /100 | #166 | Average 65.6% |
| Immigrants | Somalia | 56.4 /100 | #167 | Average 65.6% |
| Hungarians | 55.9 /100 | #168 | Average 65.6% |
| Yugoslavians | 55.7 /100 | #169 | Average 65.6% |
| Germans | 55.7 /100 | #170 | Average 65.6% |