Haitian vs Immigrants from Senegal High School Diploma
COMPARE
Haitian
Immigrants from Senegal
High School Diploma
High School Diploma Comparison
Haitians
Immigrants from Senegal
85.9%
HIGH SCHOOL DIPLOMA
0.0/ 100
METRIC RATING
291st/ 347
METRIC RANK
87.6%
HIGH SCHOOL DIPLOMA
0.9/ 100
METRIC RATING
255th/ 347
METRIC RANK
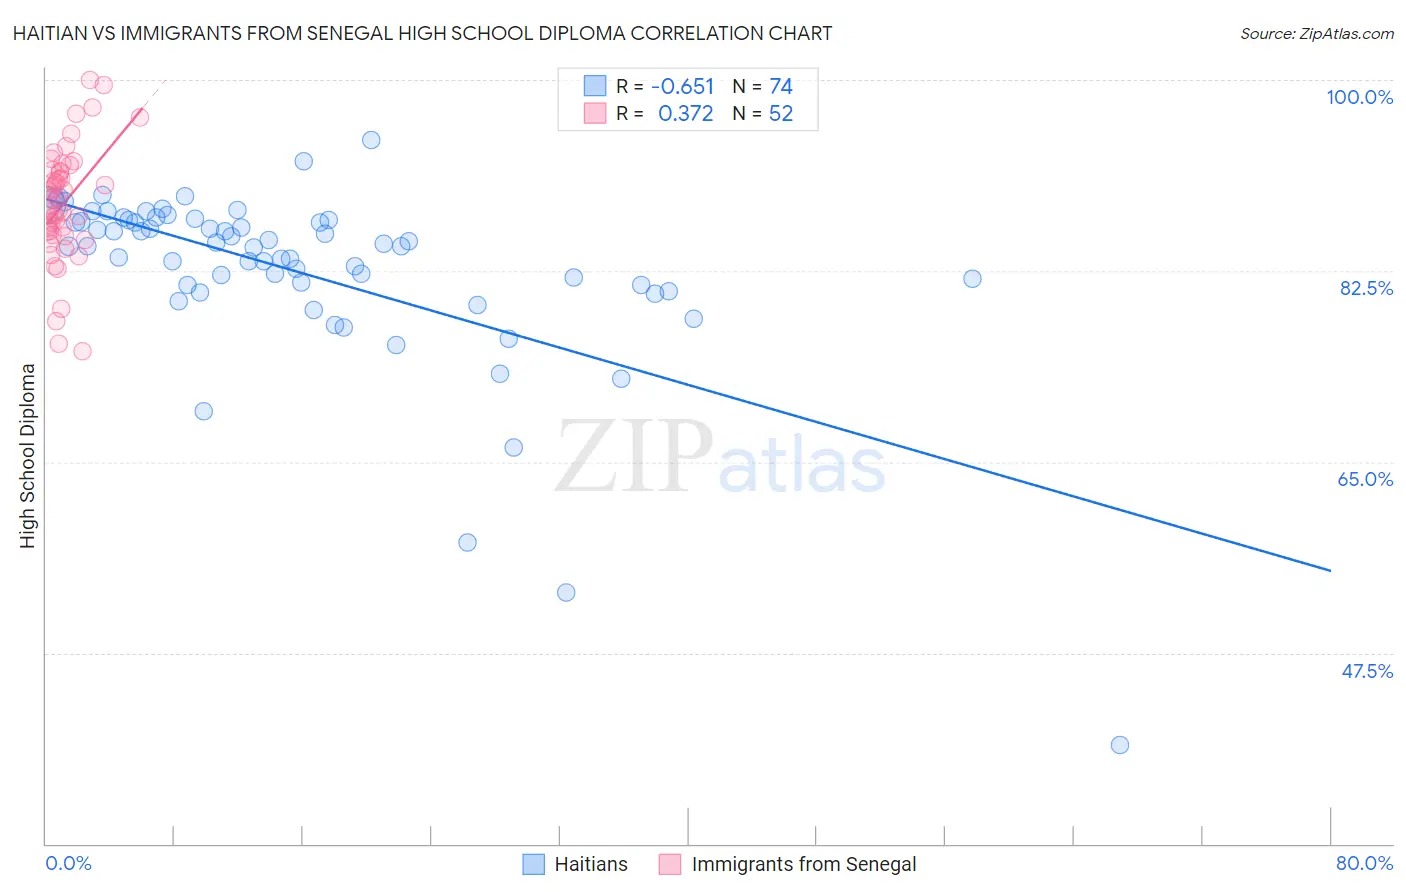
Haitian vs Immigrants from Senegal High School Diploma Correlation Chart
The statistical analysis conducted on geographies consisting of 288,018,742 people shows a significant negative correlation between the proportion of Haitians and percentage of population with at least high school diploma education in the United States with a correlation coefficient (R) of -0.651 and weighted average of 85.9%. Similarly, the statistical analysis conducted on geographies consisting of 90,130,297 people shows a mild positive correlation between the proportion of Immigrants from Senegal and percentage of population with at least high school diploma education in the United States with a correlation coefficient (R) of 0.372 and weighted average of 87.6%, a difference of 1.9%.
High School Diploma Correlation Summary
| Measurement | Haitian | Immigrants from Senegal |
| Minimum | 39.0% | 75.2% |
| Maximum | 94.5% | 100.0% |
| Range | 55.5% | 24.8% |
| Mean | 82.5% | 88.7% |
| Median | 84.8% | 88.9% |
| Interquartile 25% (IQ1) | 81.2% | 86.0% |
| Interquartile 75% (IQ3) | 87.1% | 91.7% |
| Interquartile Range (IQR) | 5.9% | 5.7% |
| Standard Deviation (Sample) | 8.5% | 5.3% |
| Standard Deviation (Population) | 8.4% | 5.2% |
Similar Demographics by High School Diploma
Demographics Similar to Haitians by High School Diploma
In terms of high school diploma, the demographic groups most similar to Haitians are Japanese (85.9%, a difference of 0.0%), British West Indian (85.9%, a difference of 0.030%), Immigrants from Fiji (85.8%, a difference of 0.060%), Immigrants (85.8%, a difference of 0.080%), and Fijian (86.0%, a difference of 0.13%).
| Demographics | Rating | Rank | High School Diploma |
| Paiute | 0.0 /100 | #284 | Tragic 86.4% |
| Immigrants | West Indies | 0.0 /100 | #285 | Tragic 86.2% |
| Immigrants | St. Vincent and the Grenadines | 0.0 /100 | #286 | Tragic 86.2% |
| Ute | 0.0 /100 | #287 | Tragic 86.2% |
| Immigrants | Vietnam | 0.0 /100 | #288 | Tragic 86.2% |
| Yup'ik | 0.0 /100 | #289 | Tragic 86.1% |
| Fijians | 0.0 /100 | #290 | Tragic 86.0% |
| Haitians | 0.0 /100 | #291 | Tragic 85.9% |
| Japanese | 0.0 /100 | #292 | Tragic 85.9% |
| British West Indians | 0.0 /100 | #293 | Tragic 85.9% |
| Immigrants | Fiji | 0.0 /100 | #294 | Tragic 85.8% |
| Immigrants | Immigrants | 0.0 /100 | #295 | Tragic 85.8% |
| Immigrants | Cambodia | 0.0 /100 | #296 | Tragic 85.6% |
| Immigrants | Grenada | 0.0 /100 | #297 | Tragic 85.6% |
| Natives/Alaskans | 0.0 /100 | #298 | Tragic 85.6% |
Demographics Similar to Immigrants from Senegal by High School Diploma
In terms of high school diploma, the demographic groups most similar to Immigrants from Senegal are Immigrants from Uruguay (87.6%, a difference of 0.060%), Immigrants from Colombia (87.6%, a difference of 0.060%), African (87.5%, a difference of 0.10%), Bahamian (87.5%, a difference of 0.10%), and Immigrants from South America (87.6%, a difference of 0.11%).
| Demographics | Rating | Rank | High School Diploma |
| Spanish Americans | 1.5 /100 | #248 | Tragic 87.7% |
| Senegalese | 1.5 /100 | #249 | Tragic 87.7% |
| Immigrants | Nigeria | 1.5 /100 | #250 | Tragic 87.7% |
| Ghanaians | 1.4 /100 | #251 | Tragic 87.7% |
| Immigrants | South America | 1.2 /100 | #252 | Tragic 87.6% |
| Immigrants | Uruguay | 1.0 /100 | #253 | Tragic 87.6% |
| Immigrants | Colombia | 1.0 /100 | #254 | Tragic 87.6% |
| Immigrants | Senegal | 0.9 /100 | #255 | Tragic 87.6% |
| Africans | 0.7 /100 | #256 | Tragic 87.5% |
| Bahamians | 0.7 /100 | #257 | Tragic 87.5% |
| Immigrants | Ghana | 0.5 /100 | #258 | Tragic 87.4% |
| Immigrants | Western Africa | 0.5 /100 | #259 | Tragic 87.4% |
| Cajuns | 0.4 /100 | #260 | Tragic 87.3% |
| Seminole | 0.4 /100 | #261 | Tragic 87.3% |
| Immigrants | Peru | 0.4 /100 | #262 | Tragic 87.3% |