Scandinavian vs Immigrants from Senegal High School Diploma
COMPARE
Scandinavian
Immigrants from Senegal
High School Diploma
High School Diploma Comparison
Scandinavians
Immigrants from Senegal
91.5%
HIGH SCHOOL DIPLOMA
99.9/ 100
METRIC RATING
23rd/ 347
METRIC RANK
87.6%
HIGH SCHOOL DIPLOMA
0.9/ 100
METRIC RATING
255th/ 347
METRIC RANK
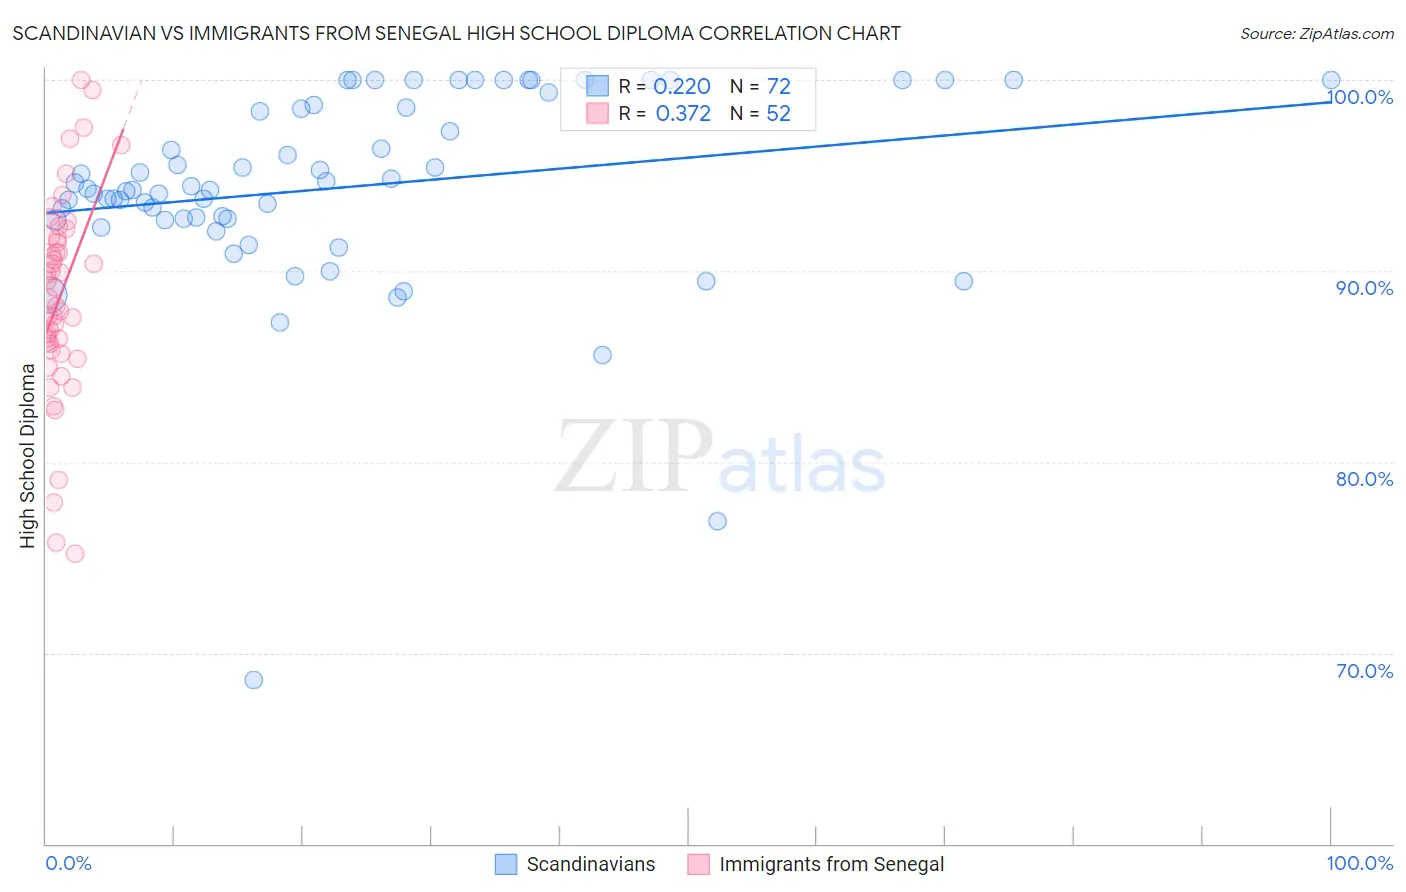
Scandinavian vs Immigrants from Senegal High School Diploma Correlation Chart
The statistical analysis conducted on geographies consisting of 472,659,475 people shows a weak positive correlation between the proportion of Scandinavians and percentage of population with at least high school diploma education in the United States with a correlation coefficient (R) of 0.220 and weighted average of 91.5%. Similarly, the statistical analysis conducted on geographies consisting of 90,130,297 people shows a mild positive correlation between the proportion of Immigrants from Senegal and percentage of population with at least high school diploma education in the United States with a correlation coefficient (R) of 0.372 and weighted average of 87.6%, a difference of 4.5%.
High School Diploma Correlation Summary
| Measurement | Scandinavian | Immigrants from Senegal |
| Minimum | 68.6% | 75.2% |
| Maximum | 100.0% | 100.0% |
| Range | 31.4% | 24.8% |
| Mean | 94.4% | 88.7% |
| Median | 94.3% | 88.9% |
| Interquartile 25% (IQ1) | 92.7% | 86.0% |
| Interquartile 75% (IQ3) | 98.6% | 91.7% |
| Interquartile Range (IQR) | 5.9% | 5.7% |
| Standard Deviation (Sample) | 5.3% | 5.3% |
| Standard Deviation (Population) | 5.2% | 5.2% |
Similar Demographics by High School Diploma
Demographics Similar to Scandinavians by High School Diploma
In terms of high school diploma, the demographic groups most similar to Scandinavians are Italian (91.5%, a difference of 0.0%), Thai (91.5%, a difference of 0.0%), Estonian (91.6%, a difference of 0.030%), Filipino (91.6%, a difference of 0.040%), and Czech (91.6%, a difference of 0.050%).
| Demographics | Rating | Rank | High School Diploma |
| Finns | 100.0 /100 | #16 | Exceptional 91.7% |
| Immigrants | Singapore | 99.9 /100 | #17 | Exceptional 91.7% |
| Germans | 99.9 /100 | #18 | Exceptional 91.7% |
| Maltese | 99.9 /100 | #19 | Exceptional 91.6% |
| Czechs | 99.9 /100 | #20 | Exceptional 91.6% |
| Filipinos | 99.9 /100 | #21 | Exceptional 91.6% |
| Estonians | 99.9 /100 | #22 | Exceptional 91.6% |
| Scandinavians | 99.9 /100 | #23 | Exceptional 91.5% |
| Italians | 99.9 /100 | #24 | Exceptional 91.5% |
| Thais | 99.9 /100 | #25 | Exceptional 91.5% |
| Russians | 99.9 /100 | #26 | Exceptional 91.5% |
| Cypriots | 99.9 /100 | #27 | Exceptional 91.5% |
| Tlingit-Haida | 99.9 /100 | #28 | Exceptional 91.4% |
| Europeans | 99.9 /100 | #29 | Exceptional 91.4% |
| Iranians | 99.9 /100 | #30 | Exceptional 91.4% |
Demographics Similar to Immigrants from Senegal by High School Diploma
In terms of high school diploma, the demographic groups most similar to Immigrants from Senegal are Immigrants from Uruguay (87.6%, a difference of 0.060%), Immigrants from Colombia (87.6%, a difference of 0.060%), African (87.5%, a difference of 0.10%), Bahamian (87.5%, a difference of 0.10%), and Immigrants from South America (87.6%, a difference of 0.11%).
| Demographics | Rating | Rank | High School Diploma |
| Spanish Americans | 1.5 /100 | #248 | Tragic 87.7% |
| Senegalese | 1.5 /100 | #249 | Tragic 87.7% |
| Immigrants | Nigeria | 1.5 /100 | #250 | Tragic 87.7% |
| Ghanaians | 1.4 /100 | #251 | Tragic 87.7% |
| Immigrants | South America | 1.2 /100 | #252 | Tragic 87.6% |
| Immigrants | Uruguay | 1.0 /100 | #253 | Tragic 87.6% |
| Immigrants | Colombia | 1.0 /100 | #254 | Tragic 87.6% |
| Immigrants | Senegal | 0.9 /100 | #255 | Tragic 87.6% |
| Africans | 0.7 /100 | #256 | Tragic 87.5% |
| Bahamians | 0.7 /100 | #257 | Tragic 87.5% |
| Immigrants | Ghana | 0.5 /100 | #258 | Tragic 87.4% |
| Immigrants | Western Africa | 0.5 /100 | #259 | Tragic 87.4% |
| Cajuns | 0.4 /100 | #260 | Tragic 87.3% |
| Seminole | 0.4 /100 | #261 | Tragic 87.3% |
| Immigrants | Peru | 0.4 /100 | #262 | Tragic 87.3% |