Immigrants from Burma/Myanmar vs Immigrants from Senegal Single Father Households
COMPARE
Immigrants from Burma/Myanmar
Immigrants from Senegal
Single Father Households
Single Father Households Comparison
Immigrants from Burma/Myanmar
Immigrants from Senegal
2.4%
SINGLE FATHER HOUSEHOLDS
12.1/ 100
METRIC RATING
221st/ 347
METRIC RANK
2.3%
SINGLE FATHER HOUSEHOLDS
79.4/ 100
METRIC RATING
158th/ 347
METRIC RANK
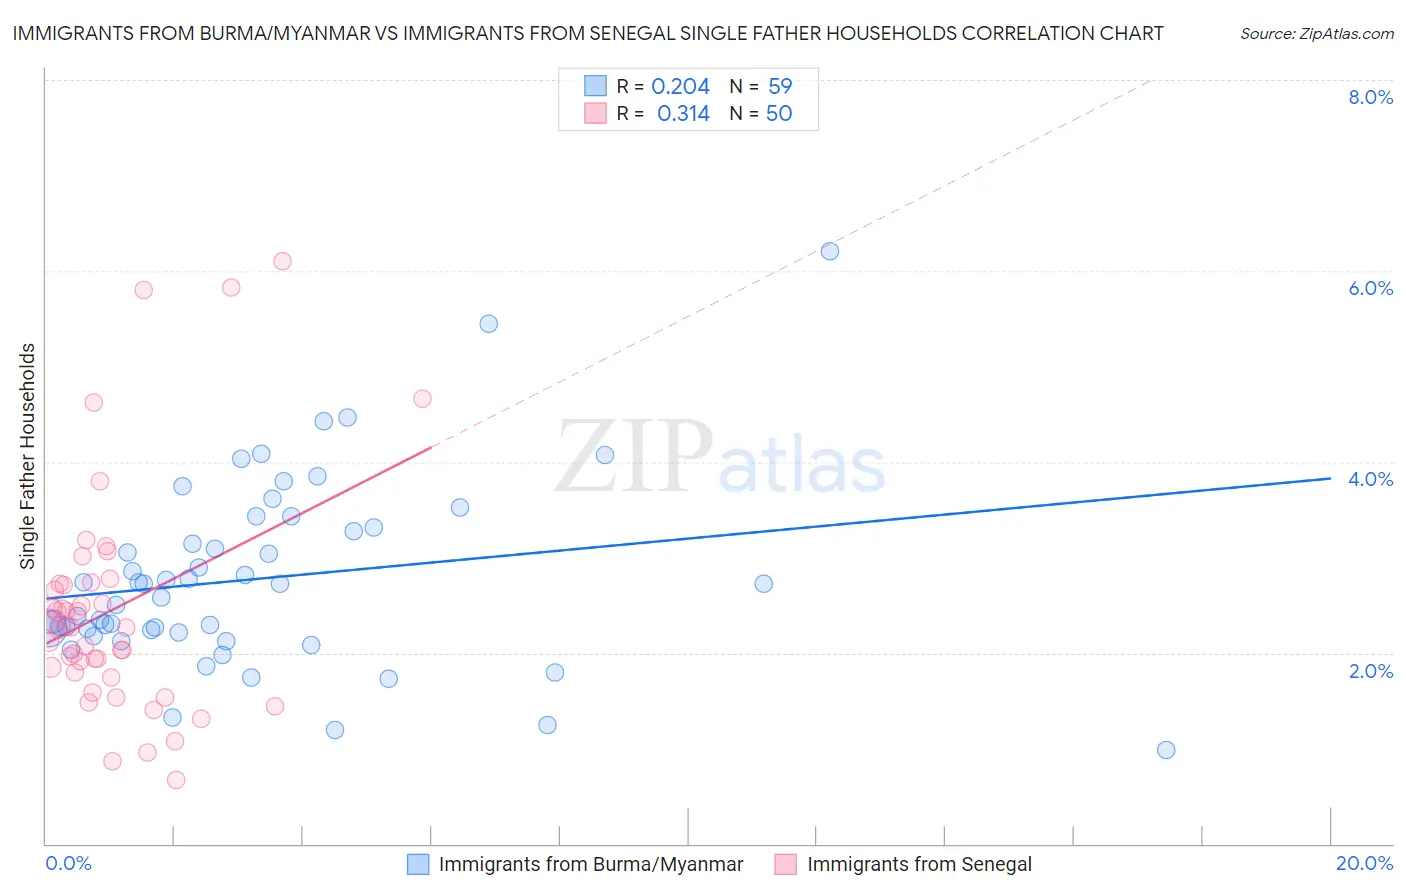
Immigrants from Burma/Myanmar vs Immigrants from Senegal Single Father Households Correlation Chart
The statistical analysis conducted on geographies consisting of 171,785,459 people shows a weak positive correlation between the proportion of Immigrants from Burma/Myanmar and percentage of single father households in the United States with a correlation coefficient (R) of 0.204 and weighted average of 2.4%. Similarly, the statistical analysis conducted on geographies consisting of 90,010,834 people shows a mild positive correlation between the proportion of Immigrants from Senegal and percentage of single father households in the United States with a correlation coefficient (R) of 0.314 and weighted average of 2.3%, a difference of 6.3%.
Single Father Households Correlation Summary
| Measurement | Immigrants from Burma/Myanmar | Immigrants from Senegal |
| Minimum | 0.98% | 0.67% |
| Maximum | 6.2% | 6.1% |
| Range | 5.2% | 5.4% |
| Mean | 2.8% | 2.5% |
| Median | 2.7% | 2.3% |
| Interquartile 25% (IQ1) | 2.2% | 1.8% |
| Interquartile 75% (IQ3) | 3.3% | 2.7% |
| Interquartile Range (IQR) | 1.1% | 0.93% |
| Standard Deviation (Sample) | 0.98% | 1.2% |
| Standard Deviation (Population) | 0.97% | 1.2% |
Similar Demographics by Single Father Households
Demographics Similar to Immigrants from Burma/Myanmar by Single Father Households
In terms of single father households, the demographic groups most similar to Immigrants from Burma/Myanmar are Immigrants from Eastern Africa (2.4%, a difference of 0.030%), Ghanaian (2.4%, a difference of 0.13%), Sudanese (2.4%, a difference of 0.14%), Immigrants from Uruguay (2.4%, a difference of 0.19%), and Immigrants from Ethiopia (2.4%, a difference of 0.21%).
| Demographics | Rating | Rank | Single Father Households |
| Ethiopians | 16.6 /100 | #214 | Poor 2.4% |
| Immigrants | South Eastern Asia | 15.9 /100 | #215 | Poor 2.4% |
| Immigrants | Ecuador | 14.9 /100 | #216 | Poor 2.4% |
| Dutch | 14.3 /100 | #217 | Poor 2.4% |
| Immigrants | Ethiopia | 13.4 /100 | #218 | Poor 2.4% |
| Sudanese | 13.0 /100 | #219 | Poor 2.4% |
| Ghanaians | 12.9 /100 | #220 | Poor 2.4% |
| Immigrants | Burma/Myanmar | 12.1 /100 | #221 | Poor 2.4% |
| Immigrants | Eastern Africa | 11.9 /100 | #222 | Poor 2.4% |
| Immigrants | Uruguay | 11.0 /100 | #223 | Poor 2.4% |
| Immigrants | Bahamas | 10.6 /100 | #224 | Poor 2.4% |
| Marshallese | 9.7 /100 | #225 | Tragic 2.4% |
| Blacks/African Americans | 9.7 /100 | #226 | Tragic 2.4% |
| Americans | 9.3 /100 | #227 | Tragic 2.4% |
| Immigrants | Ghana | 9.1 /100 | #228 | Tragic 2.4% |
Demographics Similar to Immigrants from Senegal by Single Father Households
In terms of single father households, the demographic groups most similar to Immigrants from Senegal are Canadian (2.3%, a difference of 0.030%), Immigrants from South America (2.3%, a difference of 0.050%), European (2.3%, a difference of 0.17%), Immigrants from West Indies (2.3%, a difference of 0.17%), and Bolivian (2.3%, a difference of 0.19%).
| Demographics | Rating | Rank | Single Father Households |
| Immigrants | Syria | 84.8 /100 | #151 | Excellent 2.3% |
| Immigrants | Venezuela | 83.2 /100 | #152 | Excellent 2.3% |
| Immigrants | Germany | 82.8 /100 | #153 | Excellent 2.3% |
| Bolivians | 81.0 /100 | #154 | Excellent 2.3% |
| Europeans | 80.9 /100 | #155 | Excellent 2.3% |
| Immigrants | South America | 79.9 /100 | #156 | Good 2.3% |
| Canadians | 79.7 /100 | #157 | Good 2.3% |
| Immigrants | Senegal | 79.4 /100 | #158 | Good 2.3% |
| Immigrants | West Indies | 77.9 /100 | #159 | Good 2.3% |
| Immigrants | Bolivia | 76.3 /100 | #160 | Good 2.3% |
| Swiss | 73.2 /100 | #161 | Good 2.3% |
| Scottish | 72.8 /100 | #162 | Good 2.3% |
| Irish | 72.1 /100 | #163 | Good 2.3% |
| Pakistanis | 70.6 /100 | #164 | Good 2.3% |
| Scotch-Irish | 69.4 /100 | #165 | Good 2.3% |