Immigrants from Burma/Myanmar vs Immigrants from Lithuania Average Family Size
COMPARE
Immigrants from Burma/Myanmar
Immigrants from Lithuania
Average Family Size
Average Family Size Comparison
Immigrants from Burma/Myanmar
Immigrants from Lithuania
3.29
AVERAGE FAMILY SIZE
98.6/ 100
METRIC RATING
101st/ 347
METRIC RANK
3.15
AVERAGE FAMILY SIZE
0.6/ 100
METRIC RATING
272nd/ 347
METRIC RANK
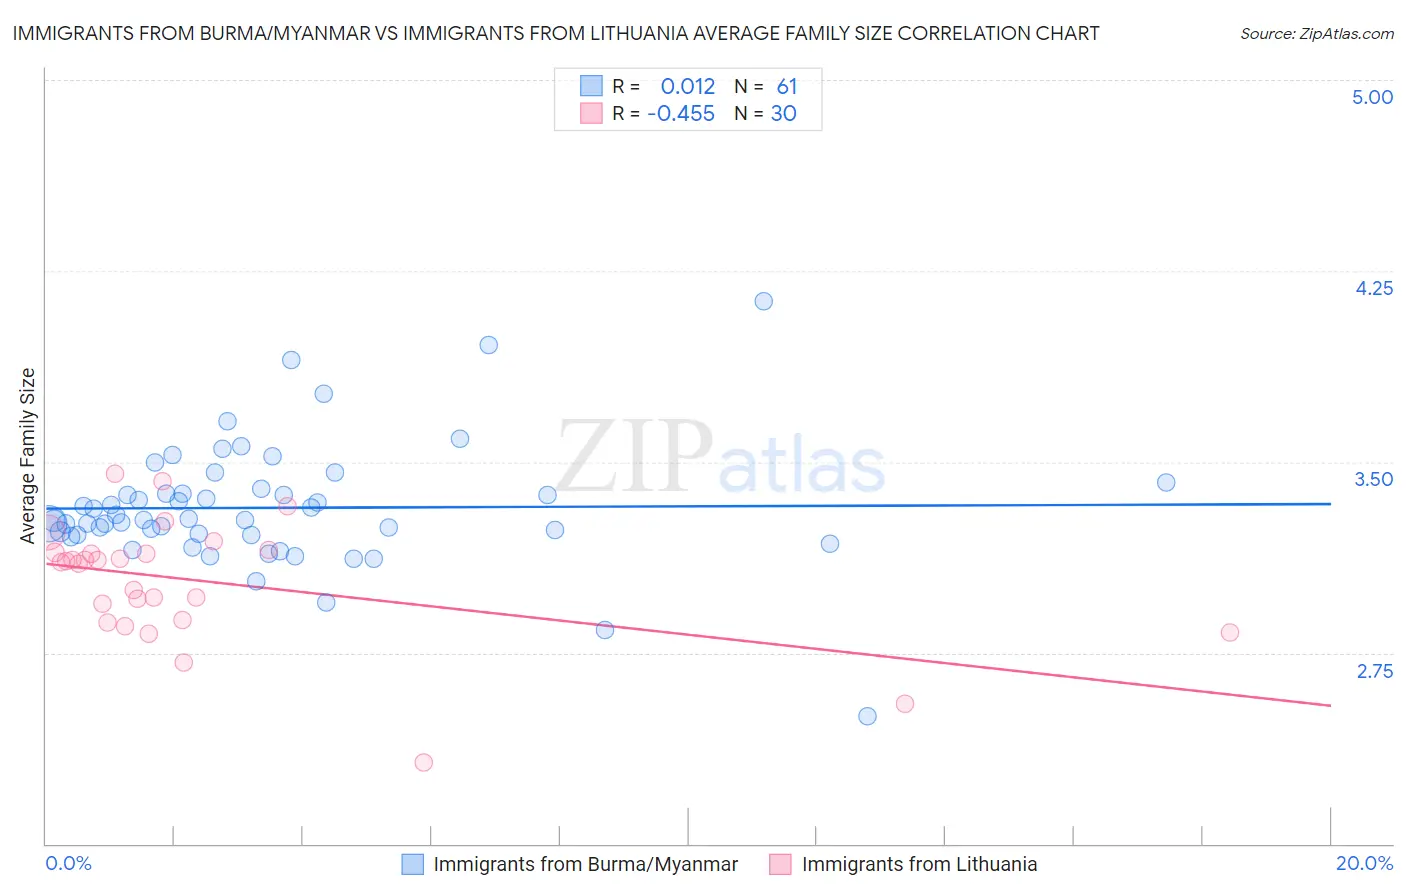
Immigrants from Burma/Myanmar vs Immigrants from Lithuania Average Family Size Correlation Chart
The statistical analysis conducted on geographies consisting of 172,260,665 people shows no correlation between the proportion of Immigrants from Burma/Myanmar and average family size in the United States with a correlation coefficient (R) of 0.012 and weighted average of 3.29. Similarly, the statistical analysis conducted on geographies consisting of 117,713,976 people shows a moderate negative correlation between the proportion of Immigrants from Lithuania and average family size in the United States with a correlation coefficient (R) of -0.455 and weighted average of 3.15, a difference of 4.3%.
Average Family Size Correlation Summary
| Measurement | Immigrants from Burma/Myanmar | Immigrants from Lithuania |
| Minimum | 2.50 | 2.32 |
| Maximum | 4.13 | 3.45 |
| Range | 1.63 | 1.13 |
| Mean | 3.32 | 3.03 |
| Median | 3.27 | 3.11 |
| Interquartile 25% (IQ1) | 3.21 | 2.88 |
| Interquartile 75% (IQ3) | 3.39 | 3.14 |
| Interquartile Range (IQR) | 0.17 | 0.26 |
| Standard Deviation (Sample) | 0.25 | 0.24 |
| Standard Deviation (Population) | 0.24 | 0.24 |
Similar Demographics by Average Family Size
Demographics Similar to Immigrants from Burma/Myanmar by Average Family Size
In terms of average family size, the demographic groups most similar to Immigrants from Burma/Myanmar are West Indian (3.29, a difference of 0.010%), Nigerian (3.29, a difference of 0.020%), Guamanian/Chamorro (3.29, a difference of 0.020%), Immigrants from Oceania (3.29, a difference of 0.030%), and Barbadian (3.29, a difference of 0.030%).
| Demographics | Rating | Rank | Average Family Size |
| Sierra Leoneans | 99.0 /100 | #94 | Exceptional 3.30 |
| Immigrants | Lebanon | 99.0 /100 | #95 | Exceptional 3.30 |
| U.S. Virgin Islanders | 98.8 /100 | #96 | Exceptional 3.29 |
| Immigrants | Oceania | 98.7 /100 | #97 | Exceptional 3.29 |
| Barbadians | 98.6 /100 | #98 | Exceptional 3.29 |
| Nigerians | 98.6 /100 | #99 | Exceptional 3.29 |
| Guamanians/Chamorros | 98.6 /100 | #100 | Exceptional 3.29 |
| Immigrants | Burma/Myanmar | 98.6 /100 | #101 | Exceptional 3.29 |
| West Indians | 98.5 /100 | #102 | Exceptional 3.29 |
| Immigrants | Western Africa | 98.4 /100 | #103 | Exceptional 3.29 |
| Bolivians | 98.3 /100 | #104 | Exceptional 3.29 |
| Immigrants | Ghana | 98.1 /100 | #105 | Exceptional 3.29 |
| Paiute | 98.0 /100 | #106 | Exceptional 3.29 |
| Ghanaians | 98.0 /100 | #107 | Exceptional 3.29 |
| Asians | 97.0 /100 | #108 | Exceptional 3.28 |
Demographics Similar to Immigrants from Lithuania by Average Family Size
In terms of average family size, the demographic groups most similar to Immigrants from Lithuania are New Zealander (3.15, a difference of 0.010%), Immigrants from Germany (3.15, a difference of 0.020%), Immigrants from Belgium (3.15, a difference of 0.020%), Cambodian (3.15, a difference of 0.020%), and Tlingit-Haida (3.16, a difference of 0.040%).
| Demographics | Rating | Rank | Average Family Size |
| Immigrants | South Africa | 0.9 /100 | #265 | Tragic 3.16 |
| Immigrants | Greece | 0.9 /100 | #266 | Tragic 3.16 |
| Iroquois | 0.8 /100 | #267 | Tragic 3.16 |
| Maltese | 0.8 /100 | #268 | Tragic 3.16 |
| Immigrants | Singapore | 0.7 /100 | #269 | Tragic 3.16 |
| Tlingit-Haida | 0.7 /100 | #270 | Tragic 3.16 |
| Immigrants | Germany | 0.7 /100 | #271 | Tragic 3.15 |
| Immigrants | Lithuania | 0.6 /100 | #272 | Tragic 3.15 |
| New Zealanders | 0.6 /100 | #273 | Tragic 3.15 |
| Immigrants | Belgium | 0.6 /100 | #274 | Tragic 3.15 |
| Cambodians | 0.6 /100 | #275 | Tragic 3.15 |
| Immigrants | Bosnia and Herzegovina | 0.5 /100 | #276 | Tragic 3.15 |
| Swiss | 0.5 /100 | #277 | Tragic 3.15 |
| Okinawans | 0.5 /100 | #278 | Tragic 3.15 |
| Immigrants | Europe | 0.5 /100 | #279 | Tragic 3.15 |