Immigrants from Burma/Myanmar vs German Russian No Schooling Completed
COMPARE
Immigrants from Burma/Myanmar
German Russian
No Schooling Completed
No Schooling Completed Comparison
Immigrants from Burma/Myanmar
German Russians
3.1%
NO SCHOOLING COMPLETED
0.0/ 100
METRIC RATING
319th/ 347
METRIC RANK
1.8%
NO SCHOOLING COMPLETED
97.5/ 100
METRIC RATING
105th/ 347
METRIC RANK
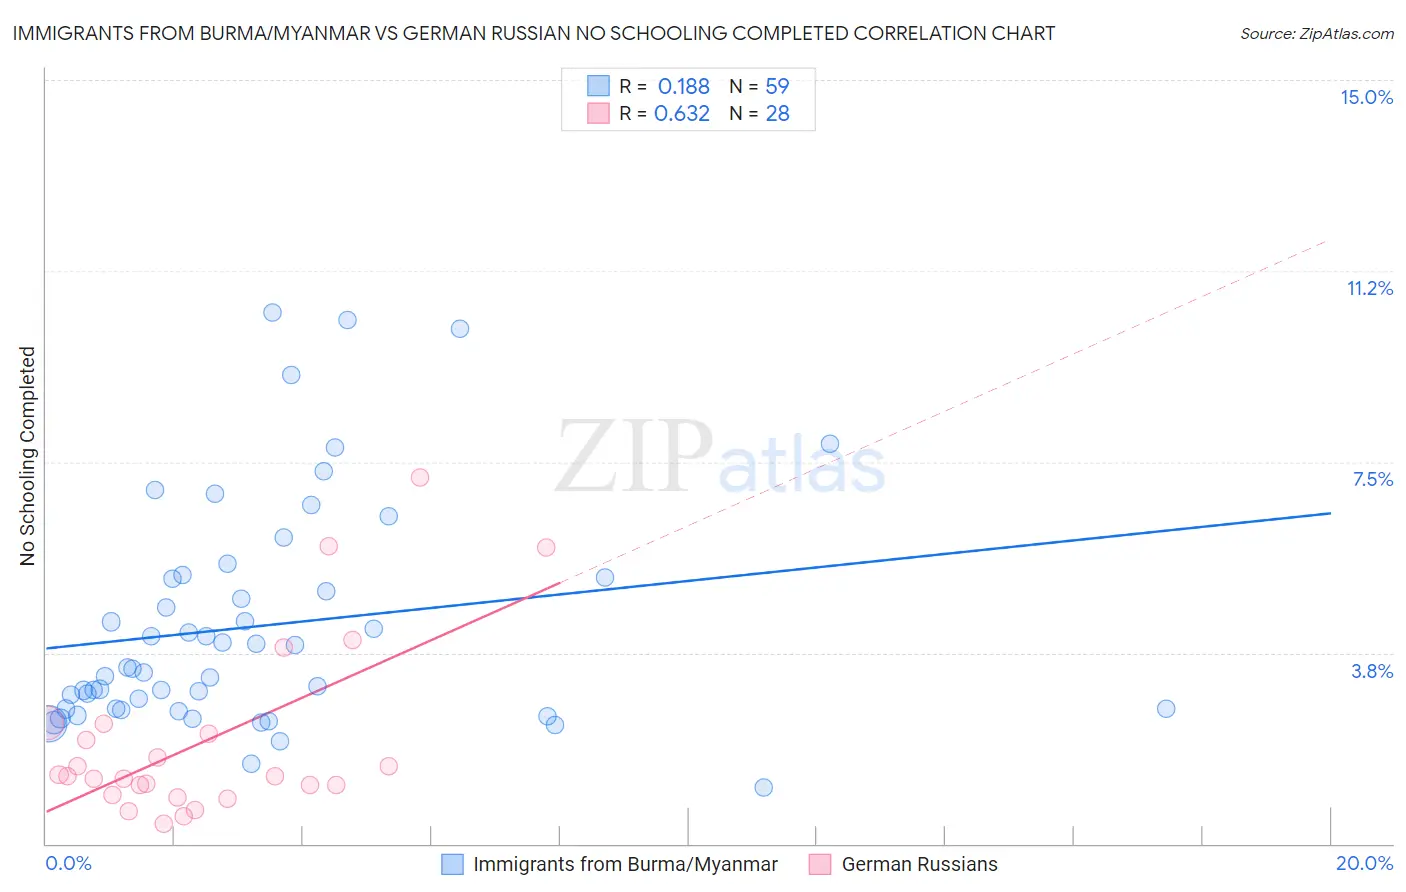
Immigrants from Burma/Myanmar vs German Russian No Schooling Completed Correlation Chart
The statistical analysis conducted on geographies consisting of 171,802,703 people shows a poor positive correlation between the proportion of Immigrants from Burma/Myanmar and percentage of population with no schooling in the United States with a correlation coefficient (R) of 0.188 and weighted average of 3.1%. Similarly, the statistical analysis conducted on geographies consisting of 96,119,740 people shows a significant positive correlation between the proportion of German Russians and percentage of population with no schooling in the United States with a correlation coefficient (R) of 0.632 and weighted average of 1.8%, a difference of 71.5%.
No Schooling Completed Correlation Summary
| Measurement | Immigrants from Burma/Myanmar | German Russian |
| Minimum | 1.1% | 0.39% |
| Maximum | 10.4% | 7.2% |
| Range | 9.3% | 6.8% |
| Mean | 4.3% | 2.0% |
| Median | 3.4% | 1.3% |
| Interquartile 25% (IQ1) | 2.6% | 1.0% |
| Interquartile 75% (IQ3) | 5.2% | 2.3% |
| Interquartile Range (IQR) | 2.6% | 1.2% |
| Standard Deviation (Sample) | 2.2% | 1.7% |
| Standard Deviation (Population) | 2.2% | 1.7% |
Similar Demographics by No Schooling Completed
Demographics Similar to Immigrants from Burma/Myanmar by No Schooling Completed
In terms of no schooling completed, the demographic groups most similar to Immigrants from Burma/Myanmar are Immigrants from Bangladesh (3.1%, a difference of 0.040%), Immigrants from Laos (3.1%, a difference of 0.15%), Immigrants from Guyana (3.1%, a difference of 0.74%), Immigrants from Honduras (3.2%, a difference of 0.83%), and Vietnamese (3.2%, a difference of 1.0%).
| Demographics | Rating | Rank | No Schooling Completed |
| Sri Lankans | 0.0 /100 | #312 | Tragic 3.0% |
| Hondurans | 0.0 /100 | #313 | Tragic 3.1% |
| Immigrants | Belize | 0.0 /100 | #314 | Tragic 3.1% |
| Immigrants | Nicaragua | 0.0 /100 | #315 | Tragic 3.1% |
| Immigrants | Ecuador | 0.0 /100 | #316 | Tragic 3.1% |
| Cape Verdeans | 0.0 /100 | #317 | Tragic 3.1% |
| Immigrants | Guyana | 0.0 /100 | #318 | Tragic 3.1% |
| Immigrants | Burma/Myanmar | 0.0 /100 | #319 | Tragic 3.1% |
| Immigrants | Bangladesh | 0.0 /100 | #320 | Tragic 3.1% |
| Immigrants | Laos | 0.0 /100 | #321 | Tragic 3.1% |
| Immigrants | Honduras | 0.0 /100 | #322 | Tragic 3.2% |
| Vietnamese | 0.0 /100 | #323 | Tragic 3.2% |
| Mexican American Indians | 0.0 /100 | #324 | Tragic 3.2% |
| Dominicans | 0.0 /100 | #325 | Tragic 3.2% |
| Indonesians | 0.0 /100 | #326 | Tragic 3.2% |
Demographics Similar to German Russians by No Schooling Completed
In terms of no schooling completed, the demographic groups most similar to German Russians are Thai (1.8%, a difference of 0.020%), Immigrants from France (1.8%, a difference of 0.40%), Yugoslavian (1.8%, a difference of 0.44%), Basque (1.8%, a difference of 0.60%), and Immigrants from Switzerland (1.8%, a difference of 0.65%).
| Demographics | Rating | Rank | No Schooling Completed |
| Iranians | 98.2 /100 | #98 | Exceptional 1.8% |
| Choctaw | 98.1 /100 | #99 | Exceptional 1.8% |
| Immigrants | Singapore | 98.0 /100 | #100 | Exceptional 1.8% |
| Immigrants | Czechoslovakia | 97.9 /100 | #101 | Exceptional 1.8% |
| Immigrants | Switzerland | 97.9 /100 | #102 | Exceptional 1.8% |
| Basques | 97.9 /100 | #103 | Exceptional 1.8% |
| Thais | 97.5 /100 | #104 | Exceptional 1.8% |
| German Russians | 97.5 /100 | #105 | Exceptional 1.8% |
| Immigrants | France | 97.3 /100 | #106 | Exceptional 1.8% |
| Yugoslavians | 97.2 /100 | #107 | Exceptional 1.8% |
| Okinawans | 97.1 /100 | #108 | Exceptional 1.8% |
| Immigrants | Saudi Arabia | 96.8 /100 | #109 | Exceptional 1.9% |
| Immigrants | Latvia | 96.7 /100 | #110 | Exceptional 1.9% |
| Immigrants | Japan | 96.6 /100 | #111 | Exceptional 1.9% |
| Pueblo | 96.4 /100 | #112 | Exceptional 1.9% |