Immigrants from Burma/Myanmar vs Immigrants from Lithuania Unemployment Among Ages 65 to 74 years
COMPARE
Immigrants from Burma/Myanmar
Immigrants from Lithuania
Unemployment Among Ages 65 to 74 years
Unemployment Among Ages 65 to 74 years Comparison
Immigrants from Burma/Myanmar
Immigrants from Lithuania
4.8%
UNEMPLOYMENT AMONG AGES 65 TO 74 YEARS
100.0/ 100
METRIC RATING
16th/ 347
METRIC RANK
5.2%
UNEMPLOYMENT AMONG AGES 65 TO 74 YEARS
95.9/ 100
METRIC RATING
102nd/ 347
METRIC RANK
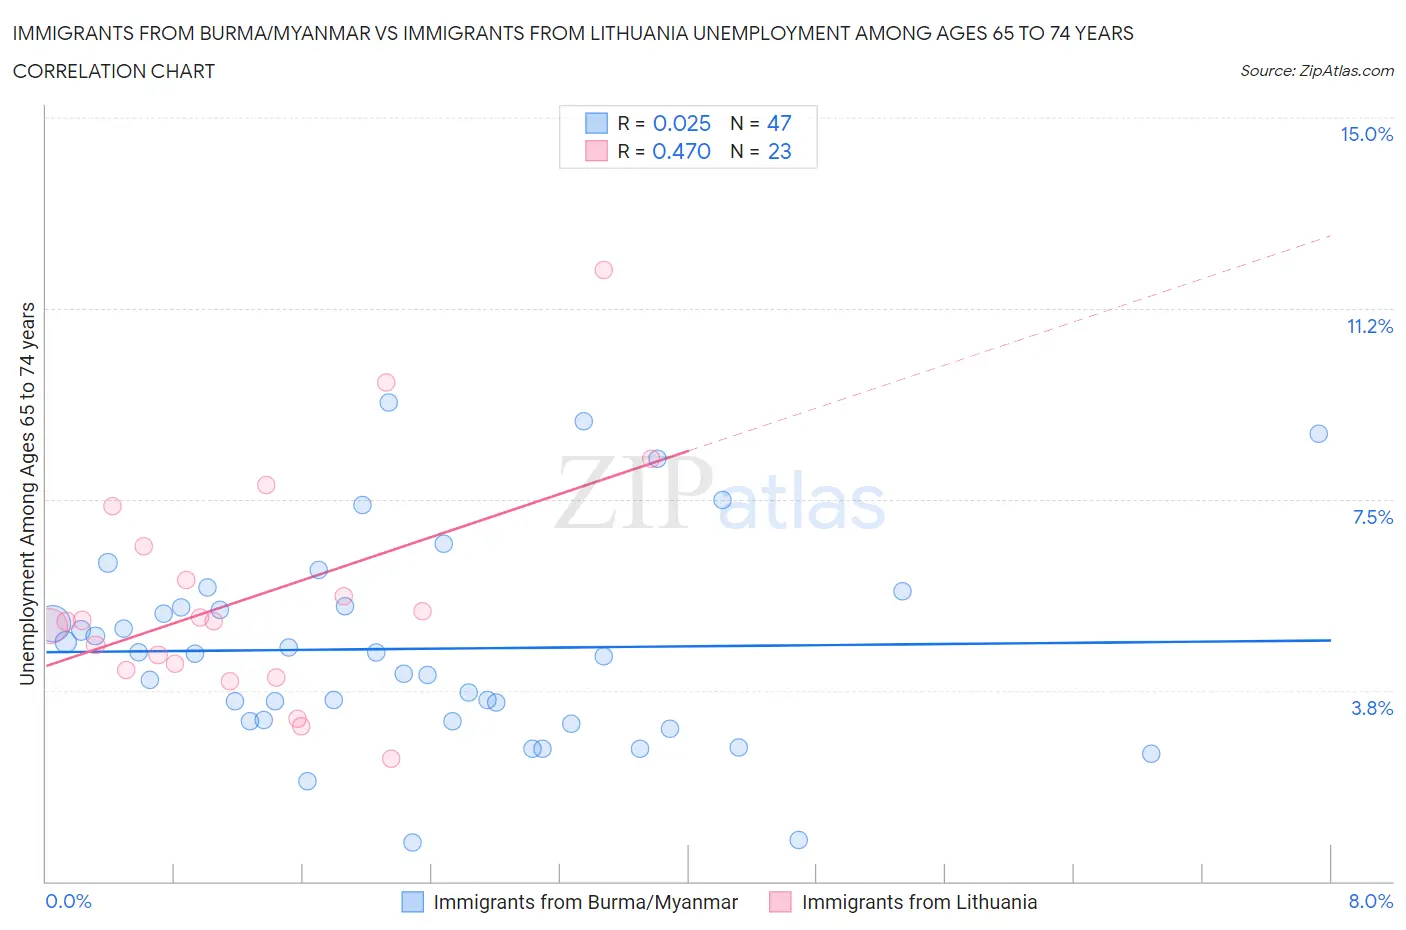
Immigrants from Burma/Myanmar vs Immigrants from Lithuania Unemployment Among Ages 65 to 74 years Correlation Chart
The statistical analysis conducted on geographies consisting of 162,372,349 people shows no correlation between the proportion of Immigrants from Burma/Myanmar and unemployment rate among population between the ages 65 and 74 in the United States with a correlation coefficient (R) of 0.025 and weighted average of 4.8%. Similarly, the statistical analysis conducted on geographies consisting of 112,270,801 people shows a moderate positive correlation between the proportion of Immigrants from Lithuania and unemployment rate among population between the ages 65 and 74 in the United States with a correlation coefficient (R) of 0.470 and weighted average of 5.2%, a difference of 8.4%.
Unemployment Among Ages 65 to 74 years Correlation Summary
| Measurement | Immigrants from Burma/Myanmar | Immigrants from Lithuania |
| Minimum | 0.75% | 2.4% |
| Maximum | 9.4% | 12.0% |
| Range | 8.6% | 9.6% |
| Mean | 4.6% | 5.6% |
| Median | 4.5% | 5.1% |
| Interquartile 25% (IQ1) | 3.1% | 4.2% |
| Interquartile 75% (IQ3) | 5.4% | 6.6% |
| Interquartile Range (IQR) | 2.3% | 2.4% |
| Standard Deviation (Sample) | 2.0% | 2.2% |
| Standard Deviation (Population) | 2.0% | 2.2% |
Similar Demographics by Unemployment Among Ages 65 to 74 years
Demographics Similar to Immigrants from Burma/Myanmar by Unemployment Among Ages 65 to 74 years
In terms of unemployment among ages 65 to 74 years, the demographic groups most similar to Immigrants from Burma/Myanmar are Kenyan (4.8%, a difference of 0.020%), Creek (4.8%, a difference of 0.090%), Menominee (4.8%, a difference of 0.14%), Immigrants from North Macedonia (4.8%, a difference of 0.29%), and Immigrants from Zaire (4.8%, a difference of 0.40%).
| Demographics | Rating | Rank | Unemployment Among Ages 65 to 74 years |
| Chickasaw | 100.0 /100 | #9 | Exceptional 4.7% |
| Osage | 100.0 /100 | #10 | Exceptional 4.7% |
| Immigrants | Congo | 100.0 /100 | #11 | Exceptional 4.7% |
| Tongans | 100.0 /100 | #12 | Exceptional 4.7% |
| Lumbee | 100.0 /100 | #13 | Exceptional 4.8% |
| Cubans | 100.0 /100 | #14 | Exceptional 4.8% |
| Immigrants | North Macedonia | 100.0 /100 | #15 | Exceptional 4.8% |
| Immigrants | Burma/Myanmar | 100.0 /100 | #16 | Exceptional 4.8% |
| Kenyans | 100.0 /100 | #17 | Exceptional 4.8% |
| Creek | 100.0 /100 | #18 | Exceptional 4.8% |
| Menominee | 100.0 /100 | #19 | Exceptional 4.8% |
| Immigrants | Zaire | 100.0 /100 | #20 | Exceptional 4.8% |
| Immigrants | Eritrea | 100.0 /100 | #21 | Exceptional 4.9% |
| Lebanese | 100.0 /100 | #22 | Exceptional 4.9% |
| Immigrants | Nepal | 100.0 /100 | #23 | Exceptional 4.9% |
Demographics Similar to Immigrants from Lithuania by Unemployment Among Ages 65 to 74 years
In terms of unemployment among ages 65 to 74 years, the demographic groups most similar to Immigrants from Lithuania are Immigrants from Vietnam (5.2%, a difference of 0.070%), Yugoslavian (5.2%, a difference of 0.090%), Japanese (5.2%, a difference of 0.10%), Immigrants from Cambodia (5.2%, a difference of 0.10%), and Burmese (5.2%, a difference of 0.12%).
| Demographics | Rating | Rank | Unemployment Among Ages 65 to 74 years |
| Serbians | 97.0 /100 | #95 | Exceptional 5.2% |
| Immigrants | Thailand | 97.0 /100 | #96 | Exceptional 5.2% |
| Senegalese | 96.5 /100 | #97 | Exceptional 5.2% |
| Welsh | 96.5 /100 | #98 | Exceptional 5.2% |
| Burmese | 96.4 /100 | #99 | Exceptional 5.2% |
| Japanese | 96.4 /100 | #100 | Exceptional 5.2% |
| Immigrants | Cambodia | 96.3 /100 | #101 | Exceptional 5.2% |
| Immigrants | Lithuania | 95.9 /100 | #102 | Exceptional 5.2% |
| Immigrants | Vietnam | 95.6 /100 | #103 | Exceptional 5.2% |
| Yugoslavians | 95.5 /100 | #104 | Exceptional 5.2% |
| Iranians | 95.2 /100 | #105 | Exceptional 5.2% |
| Malaysians | 95.1 /100 | #106 | Exceptional 5.2% |
| Austrians | 94.5 /100 | #107 | Exceptional 5.2% |
| Immigrants | Malaysia | 94.1 /100 | #108 | Exceptional 5.2% |
| Immigrants | Singapore | 93.9 /100 | #109 | Exceptional 5.2% |