Immigrants from Burma/Myanmar vs Hispanic or Latino No Schooling Completed
COMPARE
Immigrants from Burma/Myanmar
Hispanic or Latino
No Schooling Completed
No Schooling Completed Comparison
Immigrants from Burma/Myanmar
Hispanics or Latinos
3.1%
NO SCHOOLING COMPLETED
0.0/ 100
METRIC RATING
319th/ 347
METRIC RANK
3.0%
NO SCHOOLING COMPLETED
0.0/ 100
METRIC RATING
309th/ 347
METRIC RANK
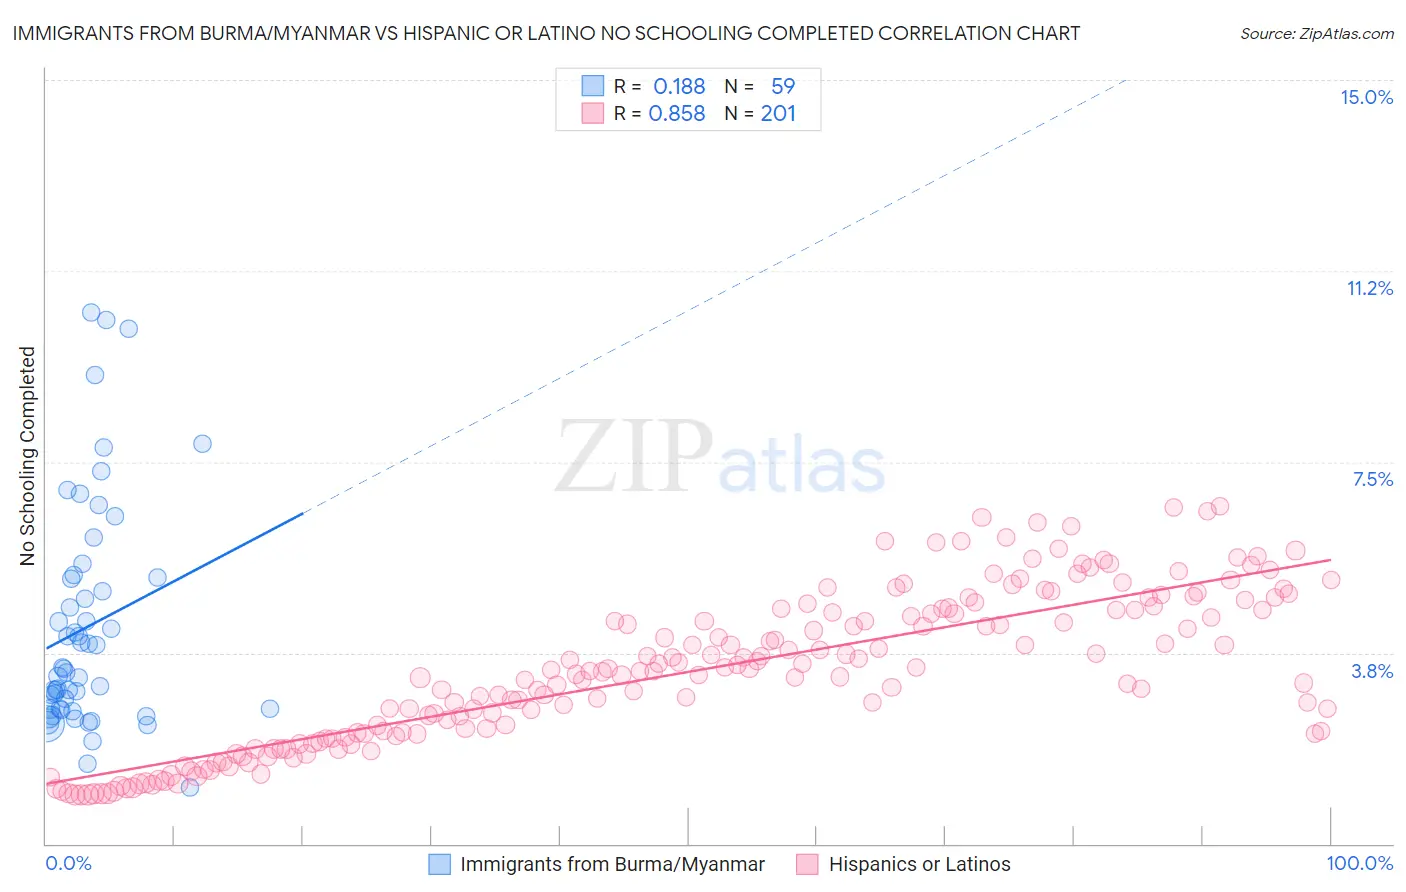
Immigrants from Burma/Myanmar vs Hispanic or Latino No Schooling Completed Correlation Chart
The statistical analysis conducted on geographies consisting of 171,802,703 people shows a poor positive correlation between the proportion of Immigrants from Burma/Myanmar and percentage of population with no schooling in the United States with a correlation coefficient (R) of 0.188 and weighted average of 3.1%. Similarly, the statistical analysis conducted on geographies consisting of 559,472,816 people shows a very strong positive correlation between the proportion of Hispanics or Latinos and percentage of population with no schooling in the United States with a correlation coefficient (R) of 0.858 and weighted average of 3.0%, a difference of 3.6%.
No Schooling Completed Correlation Summary
| Measurement | Immigrants from Burma/Myanmar | Hispanic or Latino |
| Minimum | 1.1% | 0.95% |
| Maximum | 10.4% | 6.6% |
| Range | 9.3% | 5.7% |
| Mean | 4.3% | 3.4% |
| Median | 3.4% | 3.4% |
| Interquartile 25% (IQ1) | 2.6% | 2.1% |
| Interquartile 75% (IQ3) | 5.2% | 4.6% |
| Interquartile Range (IQR) | 2.6% | 2.5% |
| Standard Deviation (Sample) | 2.2% | 1.5% |
| Standard Deviation (Population) | 2.2% | 1.5% |
Demographics Similar to Immigrants from Burma/Myanmar and Hispanics or Latinos by No Schooling Completed
In terms of no schooling completed, the demographic groups most similar to Immigrants from Burma/Myanmar are Immigrants from Bangladesh (3.1%, a difference of 0.040%), Immigrants from Laos (3.1%, a difference of 0.15%), Immigrants from Guyana (3.1%, a difference of 0.74%), Immigrants from Honduras (3.2%, a difference of 0.83%), and Vietnamese (3.2%, a difference of 1.0%). Similarly, the demographic groups most similar to Hispanics or Latinos are Guyanese (3.0%, a difference of 0.050%), Immigrants from the Azores (3.0%, a difference of 0.15%), Sri Lankan (3.0%, a difference of 0.43%), Immigrants from Somalia (3.0%, a difference of 0.81%), and Honduran (3.1%, a difference of 0.94%).
| Demographics | Rating | Rank | No Schooling Completed |
| Nicaraguans | 0.0 /100 | #304 | Tragic 2.9% |
| Ecuadorians | 0.0 /100 | #305 | Tragic 3.0% |
| Belizeans | 0.0 /100 | #306 | Tragic 3.0% |
| Immigrants | Haiti | 0.0 /100 | #307 | Tragic 3.0% |
| Immigrants | Somalia | 0.0 /100 | #308 | Tragic 3.0% |
| Hispanics or Latinos | 0.0 /100 | #309 | Tragic 3.0% |
| Guyanese | 0.0 /100 | #310 | Tragic 3.0% |
| Immigrants | Azores | 0.0 /100 | #311 | Tragic 3.0% |
| Sri Lankans | 0.0 /100 | #312 | Tragic 3.0% |
| Hondurans | 0.0 /100 | #313 | Tragic 3.1% |
| Immigrants | Belize | 0.0 /100 | #314 | Tragic 3.1% |
| Immigrants | Nicaragua | 0.0 /100 | #315 | Tragic 3.1% |
| Immigrants | Ecuador | 0.0 /100 | #316 | Tragic 3.1% |
| Cape Verdeans | 0.0 /100 | #317 | Tragic 3.1% |
| Immigrants | Guyana | 0.0 /100 | #318 | Tragic 3.1% |
| Immigrants | Burma/Myanmar | 0.0 /100 | #319 | Tragic 3.1% |
| Immigrants | Bangladesh | 0.0 /100 | #320 | Tragic 3.1% |
| Immigrants | Laos | 0.0 /100 | #321 | Tragic 3.1% |
| Immigrants | Honduras | 0.0 /100 | #322 | Tragic 3.2% |
| Vietnamese | 0.0 /100 | #323 | Tragic 3.2% |
| Mexican American Indians | 0.0 /100 | #324 | Tragic 3.2% |