Immigrants from Burma/Myanmar vs Immigrants from Albania No Schooling Completed
COMPARE
Immigrants from Burma/Myanmar
Immigrants from Albania
No Schooling Completed
No Schooling Completed Comparison
Immigrants from Burma/Myanmar
Immigrants from Albania
3.1%
NO SCHOOLING COMPLETED
0.0/ 100
METRIC RATING
319th/ 347
METRIC RANK
2.2%
NO SCHOOLING COMPLETED
28.3/ 100
METRIC RATING
194th/ 347
METRIC RANK
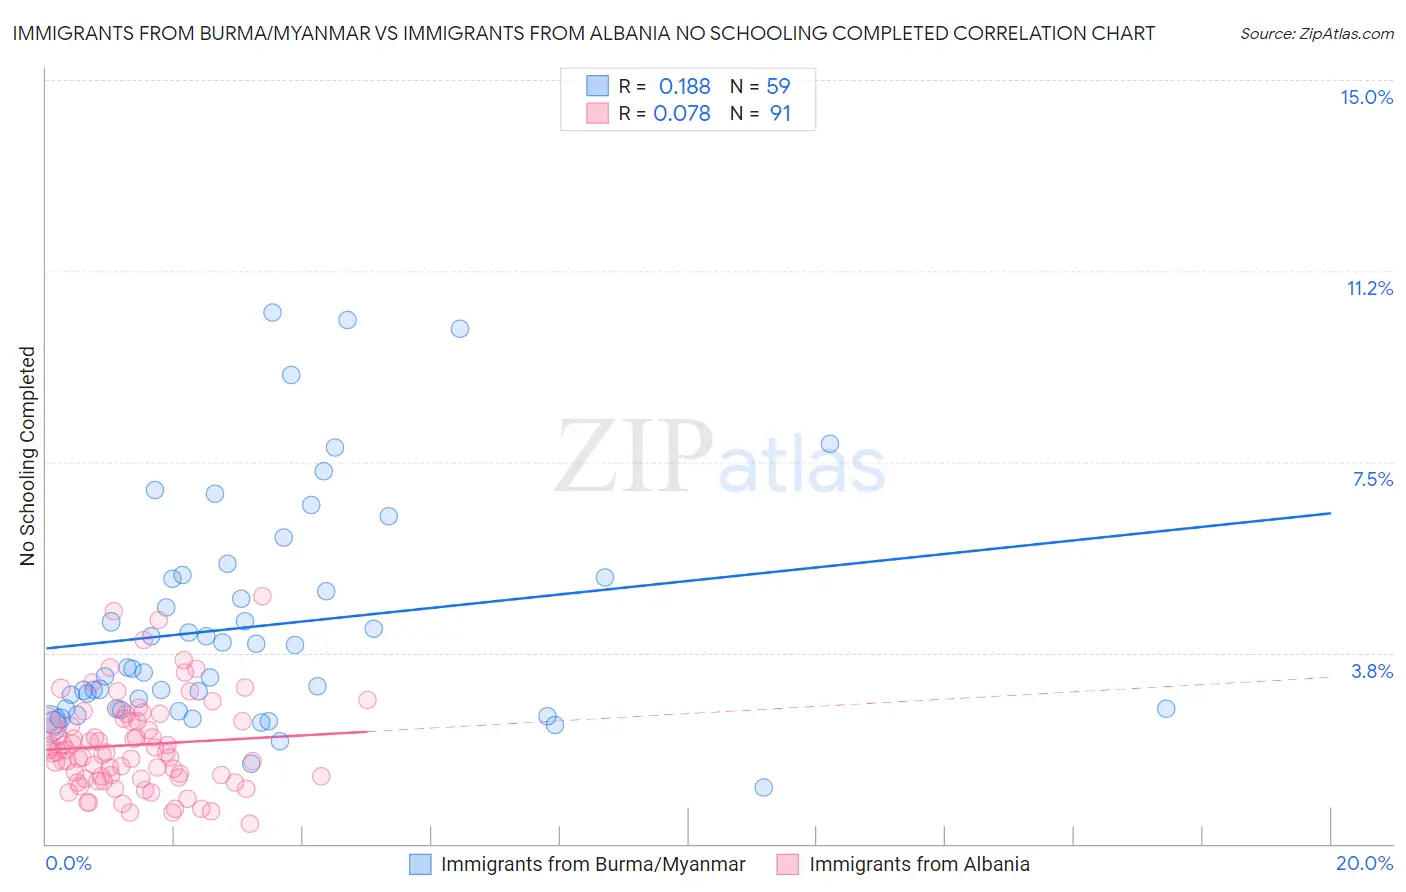
Immigrants from Burma/Myanmar vs Immigrants from Albania No Schooling Completed Correlation Chart
The statistical analysis conducted on geographies consisting of 171,802,703 people shows a poor positive correlation between the proportion of Immigrants from Burma/Myanmar and percentage of population with no schooling in the United States with a correlation coefficient (R) of 0.188 and weighted average of 3.1%. Similarly, the statistical analysis conducted on geographies consisting of 118,975,622 people shows a slight positive correlation between the proportion of Immigrants from Albania and percentage of population with no schooling in the United States with a correlation coefficient (R) of 0.078 and weighted average of 2.2%, a difference of 45.8%.
No Schooling Completed Correlation Summary
| Measurement | Immigrants from Burma/Myanmar | Immigrants from Albania |
| Minimum | 1.1% | 0.40% |
| Maximum | 10.4% | 4.9% |
| Range | 9.3% | 4.5% |
| Mean | 4.3% | 1.9% |
| Median | 3.4% | 1.8% |
| Interquartile 25% (IQ1) | 2.6% | 1.3% |
| Interquartile 75% (IQ3) | 5.2% | 2.4% |
| Interquartile Range (IQR) | 2.6% | 1.1% |
| Standard Deviation (Sample) | 2.2% | 0.91% |
| Standard Deviation (Population) | 2.2% | 0.90% |
Similar Demographics by No Schooling Completed
Demographics Similar to Immigrants from Burma/Myanmar by No Schooling Completed
In terms of no schooling completed, the demographic groups most similar to Immigrants from Burma/Myanmar are Immigrants from Bangladesh (3.1%, a difference of 0.040%), Immigrants from Laos (3.1%, a difference of 0.15%), Immigrants from Guyana (3.1%, a difference of 0.74%), Immigrants from Honduras (3.2%, a difference of 0.83%), and Vietnamese (3.2%, a difference of 1.0%).
| Demographics | Rating | Rank | No Schooling Completed |
| Sri Lankans | 0.0 /100 | #312 | Tragic 3.0% |
| Hondurans | 0.0 /100 | #313 | Tragic 3.1% |
| Immigrants | Belize | 0.0 /100 | #314 | Tragic 3.1% |
| Immigrants | Nicaragua | 0.0 /100 | #315 | Tragic 3.1% |
| Immigrants | Ecuador | 0.0 /100 | #316 | Tragic 3.1% |
| Cape Verdeans | 0.0 /100 | #317 | Tragic 3.1% |
| Immigrants | Guyana | 0.0 /100 | #318 | Tragic 3.1% |
| Immigrants | Burma/Myanmar | 0.0 /100 | #319 | Tragic 3.1% |
| Immigrants | Bangladesh | 0.0 /100 | #320 | Tragic 3.1% |
| Immigrants | Laos | 0.0 /100 | #321 | Tragic 3.1% |
| Immigrants | Honduras | 0.0 /100 | #322 | Tragic 3.2% |
| Vietnamese | 0.0 /100 | #323 | Tragic 3.2% |
| Mexican American Indians | 0.0 /100 | #324 | Tragic 3.2% |
| Dominicans | 0.0 /100 | #325 | Tragic 3.2% |
| Indonesians | 0.0 /100 | #326 | Tragic 3.2% |
Demographics Similar to Immigrants from Albania by No Schooling Completed
In terms of no schooling completed, the demographic groups most similar to Immigrants from Albania are Paraguayan (2.2%, a difference of 0.17%), Hawaiian (2.2%, a difference of 0.20%), Guamanian/Chamorro (2.2%, a difference of 0.24%), Immigrants from Ukraine (2.2%, a difference of 0.35%), and Bermudan (2.1%, a difference of 0.38%).
| Demographics | Rating | Rank | No Schooling Completed |
| Navajo | 36.5 /100 | #187 | Fair 2.1% |
| Immigrants | Kenya | 36.2 /100 | #188 | Fair 2.1% |
| Immigrants | Egypt | 36.1 /100 | #189 | Fair 2.1% |
| Spanish Americans | 32.6 /100 | #190 | Fair 2.1% |
| Bermudans | 30.7 /100 | #191 | Fair 2.1% |
| Guamanians/Chamorros | 29.8 /100 | #192 | Fair 2.2% |
| Paraguayans | 29.3 /100 | #193 | Fair 2.2% |
| Immigrants | Albania | 28.3 /100 | #194 | Fair 2.2% |
| Hawaiians | 27.0 /100 | #195 | Fair 2.2% |
| Immigrants | Ukraine | 26.1 /100 | #196 | Fair 2.2% |
| Immigrants | Southern Europe | 23.8 /100 | #197 | Fair 2.2% |
| Immigrants | Chile | 22.7 /100 | #198 | Fair 2.2% |
| Africans | 21.8 /100 | #199 | Fair 2.2% |
| Immigrants | Northern Africa | 19.5 /100 | #200 | Poor 2.2% |
| Costa Ricans | 17.1 /100 | #201 | Poor 2.2% |