Immigrants from Burma/Myanmar vs Alsatian No Schooling Completed
COMPARE
Immigrants from Burma/Myanmar
Alsatian
No Schooling Completed
No Schooling Completed Comparison
Immigrants from Burma/Myanmar
Alsatians
3.1%
NO SCHOOLING COMPLETED
0.0/ 100
METRIC RATING
319th/ 347
METRIC RANK
2.0%
NO SCHOOLING COMPLETED
79.1/ 100
METRIC RATING
144th/ 347
METRIC RANK
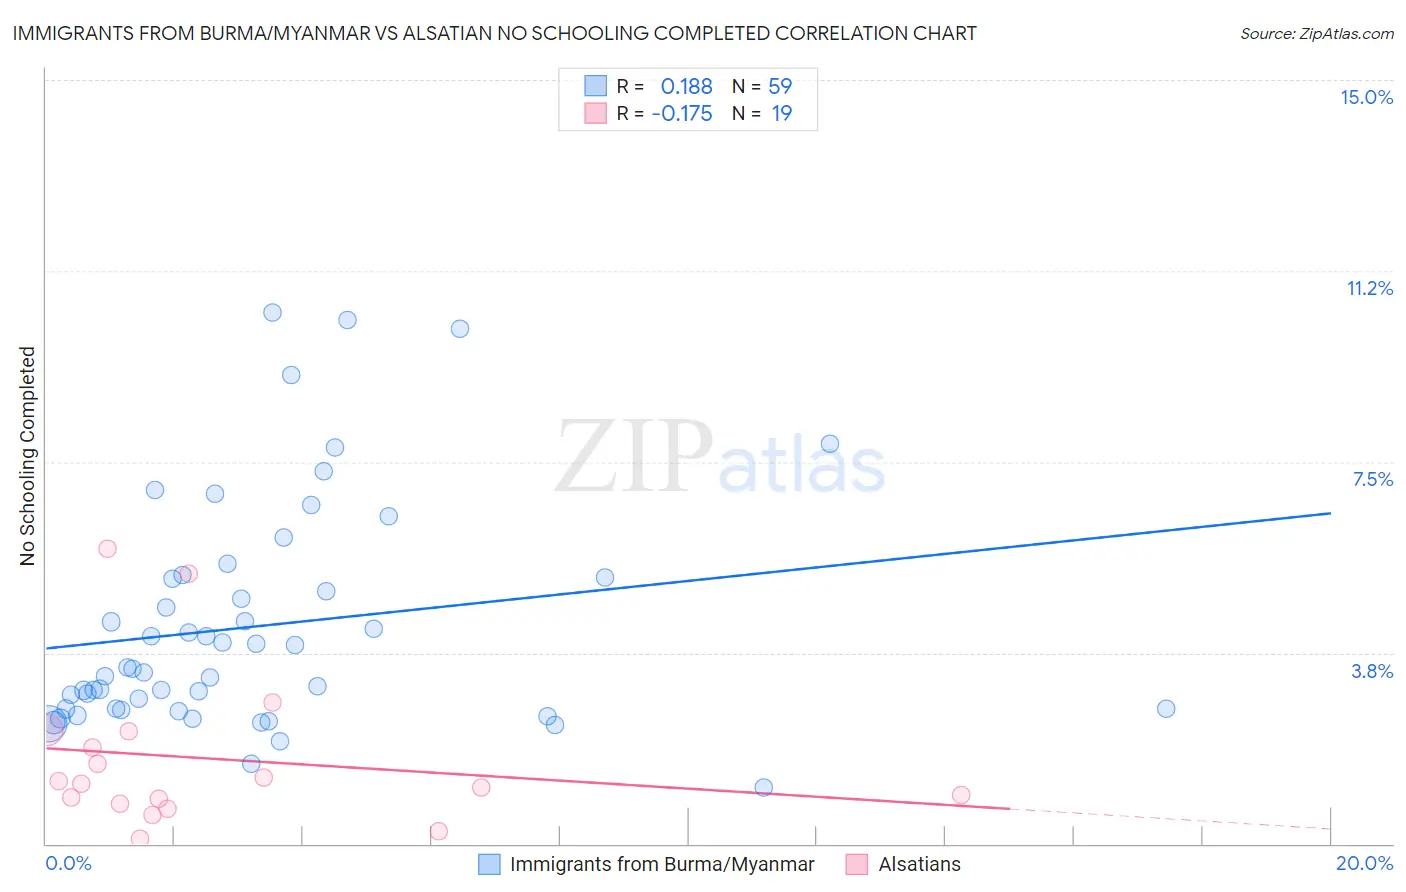
Immigrants from Burma/Myanmar vs Alsatian No Schooling Completed Correlation Chart
The statistical analysis conducted on geographies consisting of 171,802,703 people shows a poor positive correlation between the proportion of Immigrants from Burma/Myanmar and percentage of population with no schooling in the United States with a correlation coefficient (R) of 0.188 and weighted average of 3.1%. Similarly, the statistical analysis conducted on geographies consisting of 82,371,288 people shows a poor negative correlation between the proportion of Alsatians and percentage of population with no schooling in the United States with a correlation coefficient (R) of -0.175 and weighted average of 2.0%, a difference of 57.4%.
No Schooling Completed Correlation Summary
| Measurement | Immigrants from Burma/Myanmar | Alsatian |
| Minimum | 1.1% | 0.10% |
| Maximum | 10.4% | 5.8% |
| Range | 9.3% | 5.7% |
| Mean | 4.3% | 1.7% |
| Median | 3.4% | 1.2% |
| Interquartile 25% (IQ1) | 2.6% | 0.80% |
| Interquartile 75% (IQ3) | 5.2% | 2.2% |
| Interquartile Range (IQR) | 2.6% | 1.4% |
| Standard Deviation (Sample) | 2.2% | 1.5% |
| Standard Deviation (Population) | 2.2% | 1.5% |
Similar Demographics by No Schooling Completed
Demographics Similar to Immigrants from Burma/Myanmar by No Schooling Completed
In terms of no schooling completed, the demographic groups most similar to Immigrants from Burma/Myanmar are Immigrants from Bangladesh (3.1%, a difference of 0.040%), Immigrants from Laos (3.1%, a difference of 0.15%), Immigrants from Guyana (3.1%, a difference of 0.74%), Immigrants from Honduras (3.2%, a difference of 0.83%), and Vietnamese (3.2%, a difference of 1.0%).
| Demographics | Rating | Rank | No Schooling Completed |
| Sri Lankans | 0.0 /100 | #312 | Tragic 3.0% |
| Hondurans | 0.0 /100 | #313 | Tragic 3.1% |
| Immigrants | Belize | 0.0 /100 | #314 | Tragic 3.1% |
| Immigrants | Nicaragua | 0.0 /100 | #315 | Tragic 3.1% |
| Immigrants | Ecuador | 0.0 /100 | #316 | Tragic 3.1% |
| Cape Verdeans | 0.0 /100 | #317 | Tragic 3.1% |
| Immigrants | Guyana | 0.0 /100 | #318 | Tragic 3.1% |
| Immigrants | Burma/Myanmar | 0.0 /100 | #319 | Tragic 3.1% |
| Immigrants | Bangladesh | 0.0 /100 | #320 | Tragic 3.1% |
| Immigrants | Laos | 0.0 /100 | #321 | Tragic 3.1% |
| Immigrants | Honduras | 0.0 /100 | #322 | Tragic 3.2% |
| Vietnamese | 0.0 /100 | #323 | Tragic 3.2% |
| Mexican American Indians | 0.0 /100 | #324 | Tragic 3.2% |
| Dominicans | 0.0 /100 | #325 | Tragic 3.2% |
| Indonesians | 0.0 /100 | #326 | Tragic 3.2% |
Demographics Similar to Alsatians by No Schooling Completed
In terms of no schooling completed, the demographic groups most similar to Alsatians are Immigrants from Iran (2.0%, a difference of 0.010%), Immigrants from South Central Asia (2.0%, a difference of 0.20%), Immigrants from Moldova (2.0%, a difference of 0.22%), Soviet Union (2.0%, a difference of 0.40%), and Shoshone (2.0%, a difference of 0.48%).
| Demographics | Rating | Rank | No Schooling Completed |
| Filipinos | 85.5 /100 | #137 | Excellent 2.0% |
| Immigrants | Israel | 85.4 /100 | #138 | Excellent 2.0% |
| Jordanians | 84.5 /100 | #139 | Excellent 2.0% |
| Marshallese | 83.5 /100 | #140 | Excellent 2.0% |
| Immigrants | Greece | 83.5 /100 | #141 | Excellent 2.0% |
| Venezuelans | 81.5 /100 | #142 | Excellent 2.0% |
| Immigrants | South Central Asia | 80.0 /100 | #143 | Good 2.0% |
| Alsatians | 79.1 /100 | #144 | Good 2.0% |
| Immigrants | Iran | 79.0 /100 | #145 | Good 2.0% |
| Immigrants | Moldova | 78.0 /100 | #146 | Good 2.0% |
| Soviet Union | 77.1 /100 | #147 | Good 2.0% |
| Shoshone | 76.7 /100 | #148 | Good 2.0% |
| Immigrants | North Macedonia | 75.9 /100 | #149 | Good 2.0% |
| Blackfeet | 72.9 /100 | #150 | Good 2.0% |
| Immigrants | Jordan | 70.9 /100 | #151 | Good 2.0% |