Immigrants from Burma/Myanmar vs Immigrants from Iraq No Schooling Completed
COMPARE
Immigrants from Burma/Myanmar
Immigrants from Iraq
No Schooling Completed
No Schooling Completed Comparison
Immigrants from Burma/Myanmar
Immigrants from Iraq
3.1%
NO SCHOOLING COMPLETED
0.0/ 100
METRIC RATING
319th/ 347
METRIC RANK
2.4%
NO SCHOOLING COMPLETED
1.3/ 100
METRIC RATING
247th/ 347
METRIC RANK
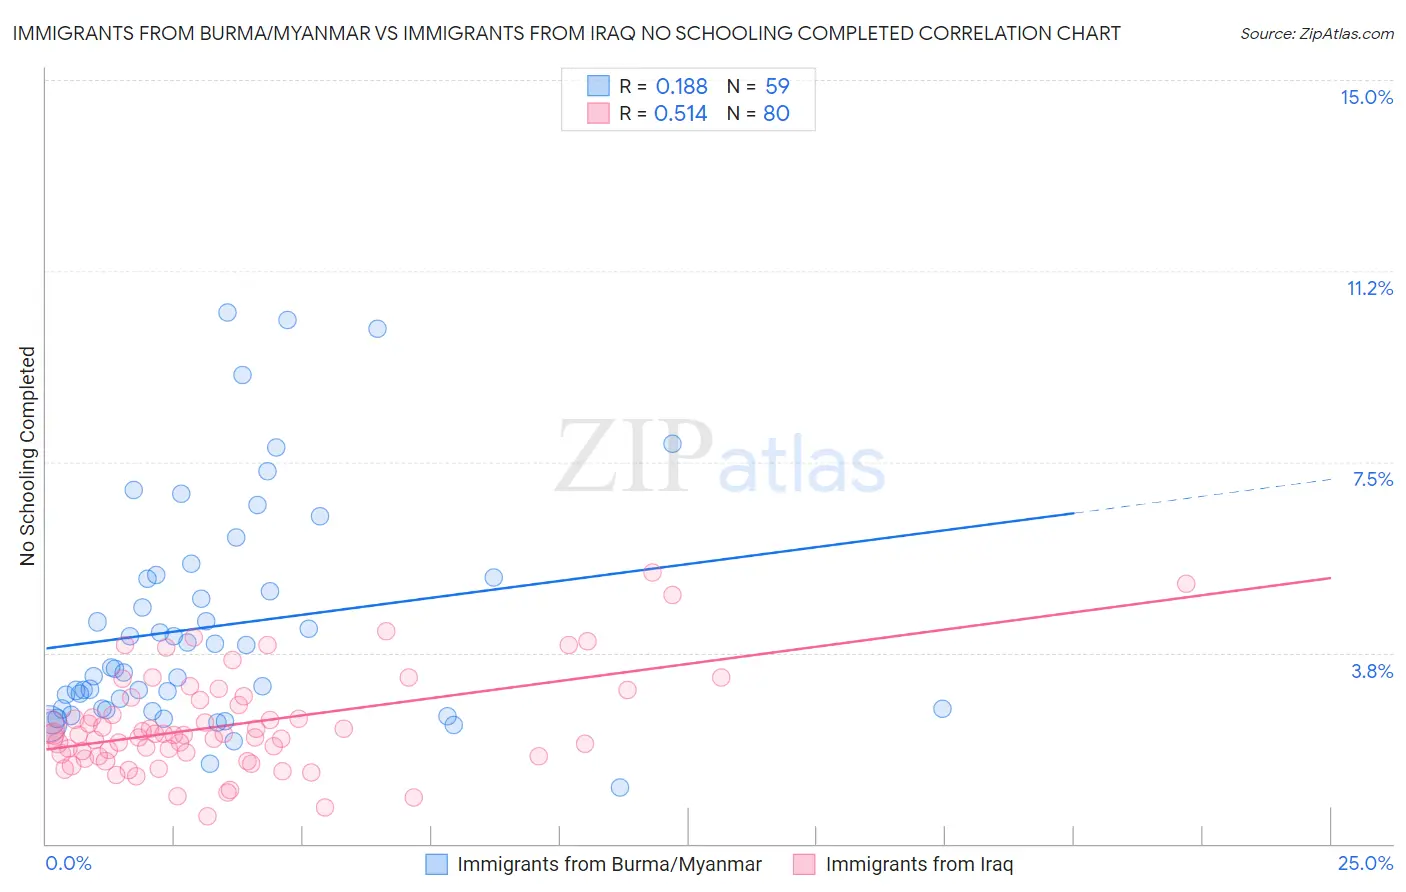
Immigrants from Burma/Myanmar vs Immigrants from Iraq No Schooling Completed Correlation Chart
The statistical analysis conducted on geographies consisting of 171,802,703 people shows a poor positive correlation between the proportion of Immigrants from Burma/Myanmar and percentage of population with no schooling in the United States with a correlation coefficient (R) of 0.188 and weighted average of 3.1%. Similarly, the statistical analysis conducted on geographies consisting of 194,285,725 people shows a substantial positive correlation between the proportion of Immigrants from Iraq and percentage of population with no schooling in the United States with a correlation coefficient (R) of 0.514 and weighted average of 2.4%, a difference of 31.4%.
No Schooling Completed Correlation Summary
| Measurement | Immigrants from Burma/Myanmar | Immigrants from Iraq |
| Minimum | 1.1% | 0.53% |
| Maximum | 10.4% | 5.3% |
| Range | 9.3% | 4.8% |
| Mean | 4.3% | 2.3% |
| Median | 3.4% | 2.1% |
| Interquartile 25% (IQ1) | 2.6% | 1.7% |
| Interquartile 75% (IQ3) | 5.2% | 2.8% |
| Interquartile Range (IQR) | 2.6% | 1.1% |
| Standard Deviation (Sample) | 2.2% | 0.98% |
| Standard Deviation (Population) | 2.2% | 0.97% |
Similar Demographics by No Schooling Completed
Demographics Similar to Immigrants from Burma/Myanmar by No Schooling Completed
In terms of no schooling completed, the demographic groups most similar to Immigrants from Burma/Myanmar are Immigrants from Bangladesh (3.1%, a difference of 0.040%), Immigrants from Laos (3.1%, a difference of 0.15%), Immigrants from Guyana (3.1%, a difference of 0.74%), Immigrants from Honduras (3.2%, a difference of 0.83%), and Vietnamese (3.2%, a difference of 1.0%).
| Demographics | Rating | Rank | No Schooling Completed |
| Sri Lankans | 0.0 /100 | #312 | Tragic 3.0% |
| Hondurans | 0.0 /100 | #313 | Tragic 3.1% |
| Immigrants | Belize | 0.0 /100 | #314 | Tragic 3.1% |
| Immigrants | Nicaragua | 0.0 /100 | #315 | Tragic 3.1% |
| Immigrants | Ecuador | 0.0 /100 | #316 | Tragic 3.1% |
| Cape Verdeans | 0.0 /100 | #317 | Tragic 3.1% |
| Immigrants | Guyana | 0.0 /100 | #318 | Tragic 3.1% |
| Immigrants | Burma/Myanmar | 0.0 /100 | #319 | Tragic 3.1% |
| Immigrants | Bangladesh | 0.0 /100 | #320 | Tragic 3.1% |
| Immigrants | Laos | 0.0 /100 | #321 | Tragic 3.1% |
| Immigrants | Honduras | 0.0 /100 | #322 | Tragic 3.2% |
| Vietnamese | 0.0 /100 | #323 | Tragic 3.2% |
| Mexican American Indians | 0.0 /100 | #324 | Tragic 3.2% |
| Dominicans | 0.0 /100 | #325 | Tragic 3.2% |
| Indonesians | 0.0 /100 | #326 | Tragic 3.2% |
Demographics Similar to Immigrants from Iraq by No Schooling Completed
In terms of no schooling completed, the demographic groups most similar to Immigrants from Iraq are Immigrants from Congo (2.4%, a difference of 0.11%), Peruvian (2.4%, a difference of 0.16%), Bolivian (2.4%, a difference of 0.16%), South American (2.4%, a difference of 0.27%), and Asian (2.4%, a difference of 0.27%).
| Demographics | Rating | Rank | No Schooling Completed |
| Immigrants | Senegal | 1.7 /100 | #240 | Tragic 2.4% |
| Koreans | 1.7 /100 | #241 | Tragic 2.4% |
| Immigrants | Indonesia | 1.5 /100 | #242 | Tragic 2.4% |
| South Americans | 1.5 /100 | #243 | Tragic 2.4% |
| Peruvians | 1.4 /100 | #244 | Tragic 2.4% |
| Bolivians | 1.4 /100 | #245 | Tragic 2.4% |
| Immigrants | Congo | 1.4 /100 | #246 | Tragic 2.4% |
| Immigrants | Iraq | 1.3 /100 | #247 | Tragic 2.4% |
| Asians | 1.2 /100 | #248 | Tragic 2.4% |
| Jamaicans | 1.2 /100 | #249 | Tragic 2.4% |
| Immigrants | Middle Africa | 1.1 /100 | #250 | Tragic 2.4% |
| Immigrants | Africa | 1.1 /100 | #251 | Tragic 2.4% |
| Immigrants | Colombia | 1.0 /100 | #252 | Tragic 2.4% |
| Immigrants | Asia | 0.9 /100 | #253 | Tragic 2.4% |
| Immigrants | Eastern Africa | 0.9 /100 | #254 | Tragic 2.4% |