Immigrants from Burma/Myanmar vs Hispanic or Latino Unemployment Among Ages 55 to 59 years
COMPARE
Immigrants from Burma/Myanmar
Hispanic or Latino
Unemployment Among Ages 55 to 59 years
Unemployment Among Ages 55 to 59 years Comparison
Immigrants from Burma/Myanmar
Hispanics or Latinos
4.4%
UNEMPLOYMENT AMONG AGES 55 TO 59 YEARS
100.0/ 100
METRIC RATING
22nd/ 347
METRIC RANK
5.4%
UNEMPLOYMENT AMONG AGES 55 TO 59 YEARS
0.0/ 100
METRIC RATING
298th/ 347
METRIC RANK
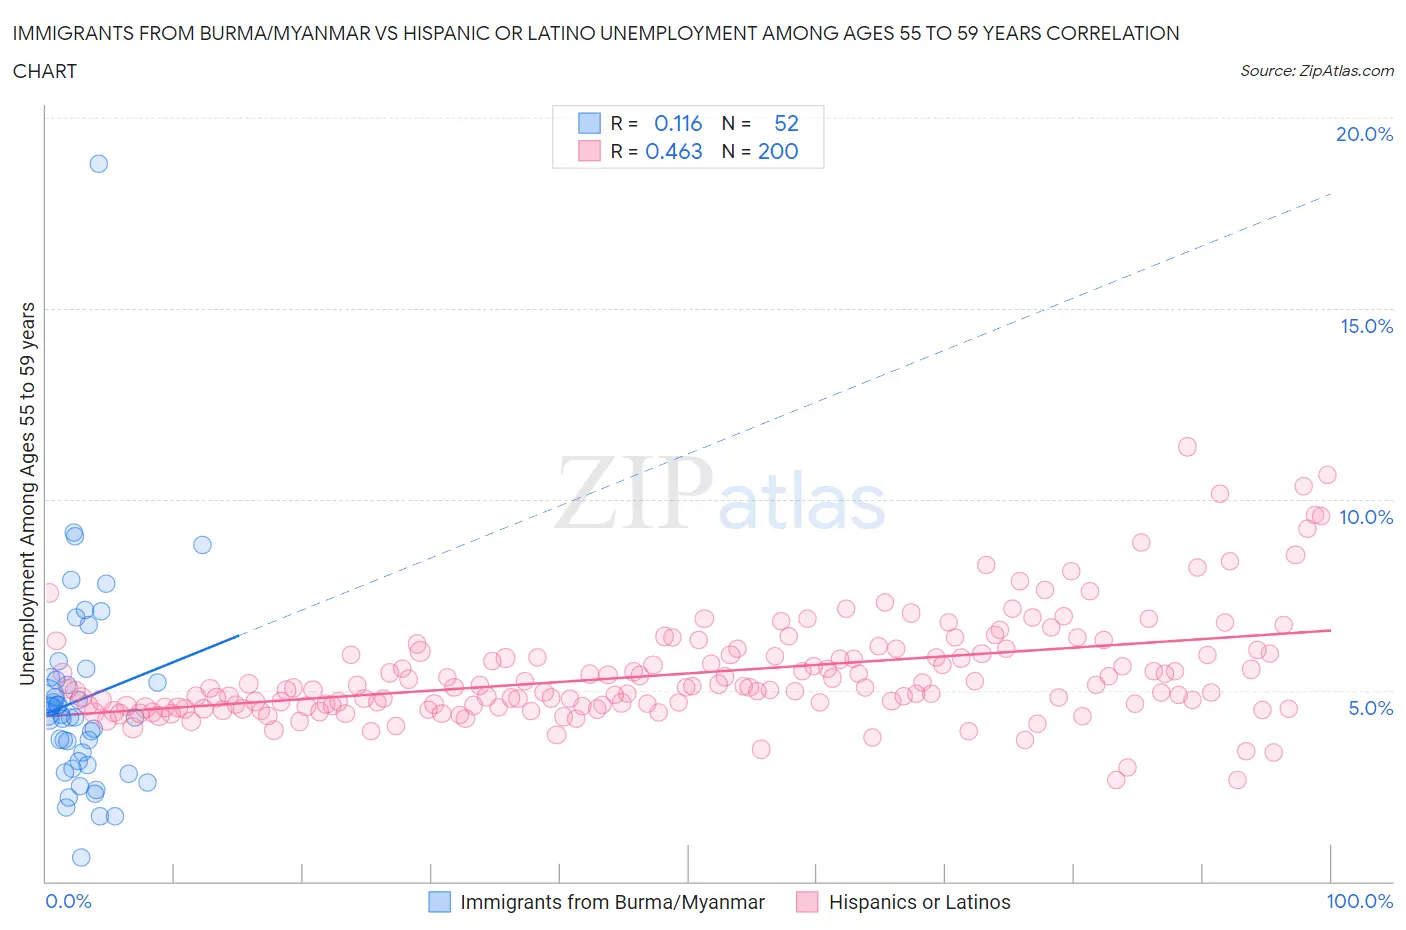
Immigrants from Burma/Myanmar vs Hispanic or Latino Unemployment Among Ages 55 to 59 years Correlation Chart
The statistical analysis conducted on geographies consisting of 167,911,825 people shows a poor positive correlation between the proportion of Immigrants from Burma/Myanmar and unemployment rate among population between the ages 55 and 59 in the United States with a correlation coefficient (R) of 0.116 and weighted average of 4.4%. Similarly, the statistical analysis conducted on geographies consisting of 491,082,633 people shows a moderate positive correlation between the proportion of Hispanics or Latinos and unemployment rate among population between the ages 55 and 59 in the United States with a correlation coefficient (R) of 0.463 and weighted average of 5.4%, a difference of 21.4%.
Unemployment Among Ages 55 to 59 years Correlation Summary
| Measurement | Immigrants from Burma/Myanmar | Hispanic or Latino |
| Minimum | 0.63% | 2.6% |
| Maximum | 18.8% | 11.4% |
| Range | 18.2% | 8.7% |
| Mean | 4.8% | 5.4% |
| Median | 4.3% | 5.1% |
| Interquartile 25% (IQ1) | 3.1% | 4.6% |
| Interquartile 75% (IQ3) | 5.3% | 5.9% |
| Interquartile Range (IQR) | 2.2% | 1.4% |
| Standard Deviation (Sample) | 2.8% | 1.4% |
| Standard Deviation (Population) | 2.7% | 1.4% |
Similar Demographics by Unemployment Among Ages 55 to 59 years
Demographics Similar to Immigrants from Burma/Myanmar by Unemployment Among Ages 55 to 59 years
In terms of unemployment among ages 55 to 59 years, the demographic groups most similar to Immigrants from Burma/Myanmar are Puget Sound Salish (4.4%, a difference of 0.090%), Swedish (4.4%, a difference of 0.24%), Kenyan (4.4%, a difference of 0.25%), Chinese (4.4%, a difference of 0.37%), and Immigrants from Somalia (4.4%, a difference of 0.46%).
| Demographics | Rating | Rank | Unemployment Among Ages 55 to 59 years |
| Bulgarians | 100.0 /100 | #15 | Exceptional 4.3% |
| Somalis | 100.0 /100 | #16 | Exceptional 4.4% |
| Czechs | 100.0 /100 | #17 | Exceptional 4.4% |
| Immigrants | Somalia | 100.0 /100 | #18 | Exceptional 4.4% |
| Chinese | 100.0 /100 | #19 | Exceptional 4.4% |
| Swedes | 100.0 /100 | #20 | Exceptional 4.4% |
| Puget Sound Salish | 100.0 /100 | #21 | Exceptional 4.4% |
| Immigrants | Burma/Myanmar | 100.0 /100 | #22 | Exceptional 4.4% |
| Kenyans | 100.0 /100 | #23 | Exceptional 4.4% |
| Jordanians | 100.0 /100 | #24 | Exceptional 4.4% |
| Immigrants | Eritrea | 100.0 /100 | #25 | Exceptional 4.4% |
| Scandinavians | 99.9 /100 | #26 | Exceptional 4.5% |
| Immigrants | Zimbabwe | 99.9 /100 | #27 | Exceptional 4.5% |
| Immigrants | Eastern Africa | 99.9 /100 | #28 | Exceptional 4.5% |
| Palestinians | 99.9 /100 | #29 | Exceptional 4.5% |
Demographics Similar to Hispanics or Latinos by Unemployment Among Ages 55 to 59 years
In terms of unemployment among ages 55 to 59 years, the demographic groups most similar to Hispanics or Latinos are Immigrants from Mexico (5.3%, a difference of 0.38%), Barbadian (5.3%, a difference of 0.60%), Dutch West Indian (5.3%, a difference of 0.64%), Cajun (5.3%, a difference of 0.76%), and Immigrants from Grenada (5.3%, a difference of 0.88%).
| Demographics | Rating | Rank | Unemployment Among Ages 55 to 59 years |
| Trinidadians and Tobagonians | 0.0 /100 | #291 | Tragic 5.3% |
| British West Indians | 0.0 /100 | #292 | Tragic 5.3% |
| Immigrants | Grenada | 0.0 /100 | #293 | Tragic 5.3% |
| Cajuns | 0.0 /100 | #294 | Tragic 5.3% |
| Dutch West Indians | 0.0 /100 | #295 | Tragic 5.3% |
| Barbadians | 0.0 /100 | #296 | Tragic 5.3% |
| Immigrants | Mexico | 0.0 /100 | #297 | Tragic 5.3% |
| Hispanics or Latinos | 0.0 /100 | #298 | Tragic 5.4% |
| Cape Verdeans | 0.0 /100 | #299 | Tragic 5.4% |
| Immigrants | St. Vincent and the Grenadines | 0.0 /100 | #300 | Tragic 5.4% |
| Immigrants | Dominica | 0.0 /100 | #301 | Tragic 5.5% |
| Sierra Leoneans | 0.0 /100 | #302 | Tragic 5.5% |
| Marshallese | 0.0 /100 | #303 | Tragic 5.5% |
| Blacks/African Americans | 0.0 /100 | #304 | Tragic 5.5% |
| Immigrants | Portugal | 0.0 /100 | #305 | Tragic 5.5% |