British vs Hispanic or Latino No Schooling Completed
COMPARE
British
Hispanic or Latino
No Schooling Completed
No Schooling Completed Comparison
British
Hispanics or Latinos
1.5%
NO SCHOOLING COMPLETED
100.0/ 100
METRIC RATING
30th/ 347
METRIC RANK
3.0%
NO SCHOOLING COMPLETED
0.0/ 100
METRIC RATING
309th/ 347
METRIC RANK
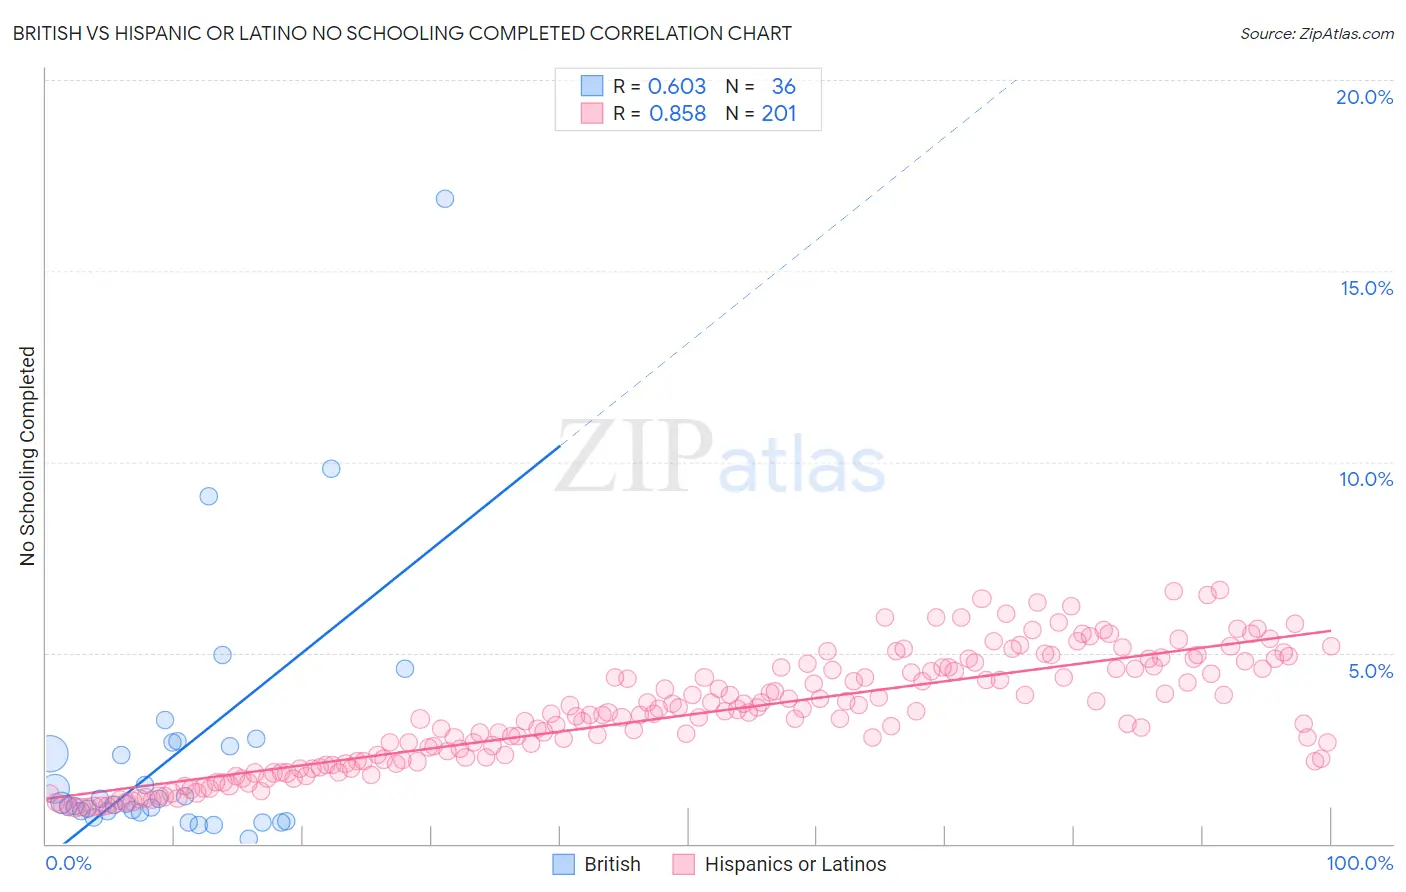
British vs Hispanic or Latino No Schooling Completed Correlation Chart
The statistical analysis conducted on geographies consisting of 518,649,413 people shows a significant positive correlation between the proportion of British and percentage of population with no schooling in the United States with a correlation coefficient (R) of 0.603 and weighted average of 1.5%. Similarly, the statistical analysis conducted on geographies consisting of 559,472,816 people shows a very strong positive correlation between the proportion of Hispanics or Latinos and percentage of population with no schooling in the United States with a correlation coefficient (R) of 0.858 and weighted average of 3.0%, a difference of 99.5%.
No Schooling Completed Correlation Summary
| Measurement | British | Hispanic or Latino |
| Minimum | 0.14% | 0.95% |
| Maximum | 16.9% | 6.6% |
| Range | 16.8% | 5.7% |
| Mean | 2.4% | 3.4% |
| Median | 1.1% | 3.4% |
| Interquartile 25% (IQ1) | 0.83% | 2.1% |
| Interquartile 75% (IQ3) | 2.6% | 4.6% |
| Interquartile Range (IQR) | 1.8% | 2.5% |
| Standard Deviation (Sample) | 3.3% | 1.5% |
| Standard Deviation (Population) | 3.3% | 1.5% |
Similar Demographics by No Schooling Completed
Demographics Similar to British by No Schooling Completed
In terms of no schooling completed, the demographic groups most similar to British are Inupiat (1.5%, a difference of 0.030%), Swiss (1.5%, a difference of 0.42%), Lumbee (1.5%, a difference of 0.48%), Italian (1.5%, a difference of 1.1%), and Latvian (1.5%, a difference of 1.4%).
| Demographics | Rating | Rank | No Schooling Completed |
| Europeans | 100.0 /100 | #23 | Exceptional 1.5% |
| Pennsylvania Germans | 100.0 /100 | #24 | Exceptional 1.5% |
| French | 100.0 /100 | #25 | Exceptional 1.5% |
| Czechs | 100.0 /100 | #26 | Exceptional 1.5% |
| Scandinavians | 100.0 /100 | #27 | Exceptional 1.5% |
| French Canadians | 100.0 /100 | #28 | Exceptional 1.5% |
| Lumbee | 100.0 /100 | #29 | Exceptional 1.5% |
| British | 100.0 /100 | #30 | Exceptional 1.5% |
| Inupiat | 100.0 /100 | #31 | Exceptional 1.5% |
| Swiss | 100.0 /100 | #32 | Exceptional 1.5% |
| Italians | 100.0 /100 | #33 | Exceptional 1.5% |
| Latvians | 100.0 /100 | #34 | Exceptional 1.5% |
| Eastern Europeans | 100.0 /100 | #35 | Exceptional 1.6% |
| Aleuts | 99.9 /100 | #36 | Exceptional 1.6% |
| Belgians | 99.9 /100 | #37 | Exceptional 1.6% |
Demographics Similar to Hispanics or Latinos by No Schooling Completed
In terms of no schooling completed, the demographic groups most similar to Hispanics or Latinos are Guyanese (3.0%, a difference of 0.050%), Immigrants from the Azores (3.0%, a difference of 0.15%), Sri Lankan (3.0%, a difference of 0.43%), Immigrants from Somalia (3.0%, a difference of 0.81%), and Honduran (3.1%, a difference of 0.94%).
| Demographics | Rating | Rank | No Schooling Completed |
| Immigrants | Caribbean | 0.0 /100 | #302 | Tragic 2.9% |
| Somalis | 0.0 /100 | #303 | Tragic 2.9% |
| Nicaraguans | 0.0 /100 | #304 | Tragic 2.9% |
| Ecuadorians | 0.0 /100 | #305 | Tragic 3.0% |
| Belizeans | 0.0 /100 | #306 | Tragic 3.0% |
| Immigrants | Haiti | 0.0 /100 | #307 | Tragic 3.0% |
| Immigrants | Somalia | 0.0 /100 | #308 | Tragic 3.0% |
| Hispanics or Latinos | 0.0 /100 | #309 | Tragic 3.0% |
| Guyanese | 0.0 /100 | #310 | Tragic 3.0% |
| Immigrants | Azores | 0.0 /100 | #311 | Tragic 3.0% |
| Sri Lankans | 0.0 /100 | #312 | Tragic 3.0% |
| Hondurans | 0.0 /100 | #313 | Tragic 3.1% |
| Immigrants | Belize | 0.0 /100 | #314 | Tragic 3.1% |
| Immigrants | Nicaragua | 0.0 /100 | #315 | Tragic 3.1% |
| Immigrants | Ecuador | 0.0 /100 | #316 | Tragic 3.1% |