Brazilian vs Hispanic or Latino No Schooling Completed
COMPARE
Brazilian
Hispanic or Latino
No Schooling Completed
No Schooling Completed Comparison
Brazilians
Hispanics or Latinos
2.1%
NO SCHOOLING COMPLETED
60.2/ 100
METRIC RATING
165th/ 347
METRIC RANK
3.0%
NO SCHOOLING COMPLETED
0.0/ 100
METRIC RATING
309th/ 347
METRIC RANK
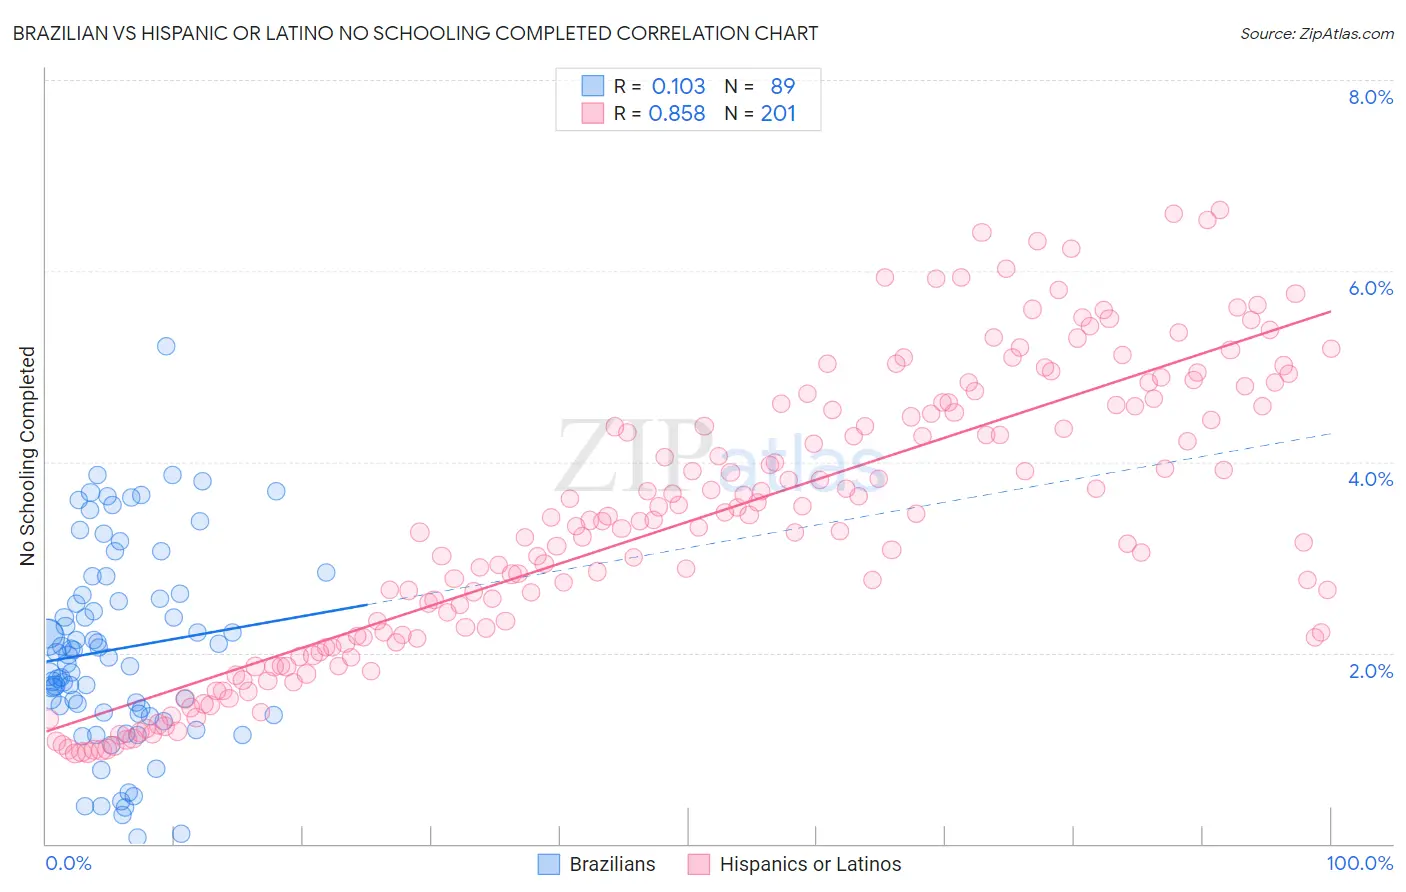
Brazilian vs Hispanic or Latino No Schooling Completed Correlation Chart
The statistical analysis conducted on geographies consisting of 321,239,467 people shows a poor positive correlation between the proportion of Brazilians and percentage of population with no schooling in the United States with a correlation coefficient (R) of 0.103 and weighted average of 2.1%. Similarly, the statistical analysis conducted on geographies consisting of 559,472,816 people shows a very strong positive correlation between the proportion of Hispanics or Latinos and percentage of population with no schooling in the United States with a correlation coefficient (R) of 0.858 and weighted average of 3.0%, a difference of 47.2%.
No Schooling Completed Correlation Summary
| Measurement | Brazilian | Hispanic or Latino |
| Minimum | 0.065% | 0.95% |
| Maximum | 5.2% | 6.6% |
| Range | 5.1% | 5.7% |
| Mean | 2.0% | 3.4% |
| Median | 2.0% | 3.4% |
| Interquartile 25% (IQ1) | 1.4% | 2.1% |
| Interquartile 75% (IQ3) | 2.6% | 4.6% |
| Interquartile Range (IQR) | 1.2% | 2.5% |
| Standard Deviation (Sample) | 1.0% | 1.5% |
| Standard Deviation (Population) | 1.0% | 1.5% |
Similar Demographics by No Schooling Completed
Demographics Similar to Brazilians by No Schooling Completed
In terms of no schooling completed, the demographic groups most similar to Brazilians are Dutch West Indian (2.1%, a difference of 0.050%), Comanche (2.1%, a difference of 0.060%), Egyptian (2.1%, a difference of 0.15%), Cheyenne (2.1%, a difference of 0.23%), and Albanian (2.1%, a difference of 0.28%).
| Demographics | Rating | Rank | No Schooling Completed |
| Immigrants | Korea | 66.7 /100 | #158 | Good 2.0% |
| Immigrants | Spain | 66.4 /100 | #159 | Good 2.0% |
| Kenyans | 65.7 /100 | #160 | Good 2.0% |
| Ugandans | 64.6 /100 | #161 | Good 2.0% |
| Immigrants | Brazil | 63.8 /100 | #162 | Good 2.1% |
| Albanians | 62.2 /100 | #163 | Good 2.1% |
| Comanche | 60.7 /100 | #164 | Good 2.1% |
| Brazilians | 60.2 /100 | #165 | Good 2.1% |
| Dutch West Indians | 59.9 /100 | #166 | Average 2.1% |
| Egyptians | 59.2 /100 | #167 | Average 2.1% |
| Cheyenne | 58.6 /100 | #168 | Average 2.1% |
| Apache | 56.7 /100 | #169 | Average 2.1% |
| Argentineans | 56.0 /100 | #170 | Average 2.1% |
| Immigrants | Poland | 55.2 /100 | #171 | Average 2.1% |
| Immigrants | Argentina | 52.7 /100 | #172 | Average 2.1% |
Demographics Similar to Hispanics or Latinos by No Schooling Completed
In terms of no schooling completed, the demographic groups most similar to Hispanics or Latinos are Guyanese (3.0%, a difference of 0.050%), Immigrants from the Azores (3.0%, a difference of 0.15%), Sri Lankan (3.0%, a difference of 0.43%), Immigrants from Somalia (3.0%, a difference of 0.81%), and Honduran (3.1%, a difference of 0.94%).
| Demographics | Rating | Rank | No Schooling Completed |
| Immigrants | Caribbean | 0.0 /100 | #302 | Tragic 2.9% |
| Somalis | 0.0 /100 | #303 | Tragic 2.9% |
| Nicaraguans | 0.0 /100 | #304 | Tragic 2.9% |
| Ecuadorians | 0.0 /100 | #305 | Tragic 3.0% |
| Belizeans | 0.0 /100 | #306 | Tragic 3.0% |
| Immigrants | Haiti | 0.0 /100 | #307 | Tragic 3.0% |
| Immigrants | Somalia | 0.0 /100 | #308 | Tragic 3.0% |
| Hispanics or Latinos | 0.0 /100 | #309 | Tragic 3.0% |
| Guyanese | 0.0 /100 | #310 | Tragic 3.0% |
| Immigrants | Azores | 0.0 /100 | #311 | Tragic 3.0% |
| Sri Lankans | 0.0 /100 | #312 | Tragic 3.0% |
| Hondurans | 0.0 /100 | #313 | Tragic 3.1% |
| Immigrants | Belize | 0.0 /100 | #314 | Tragic 3.1% |
| Immigrants | Nicaragua | 0.0 /100 | #315 | Tragic 3.1% |
| Immigrants | Ecuador | 0.0 /100 | #316 | Tragic 3.1% |