Irish vs Hispanic or Latino No Schooling Completed
COMPARE
Irish
Hispanic or Latino
No Schooling Completed
No Schooling Completed Comparison
Irish
Hispanics or Latinos
1.4%
NO SCHOOLING COMPLETED
100.0/ 100
METRIC RATING
12th/ 347
METRIC RANK
3.0%
NO SCHOOLING COMPLETED
0.0/ 100
METRIC RATING
309th/ 347
METRIC RANK
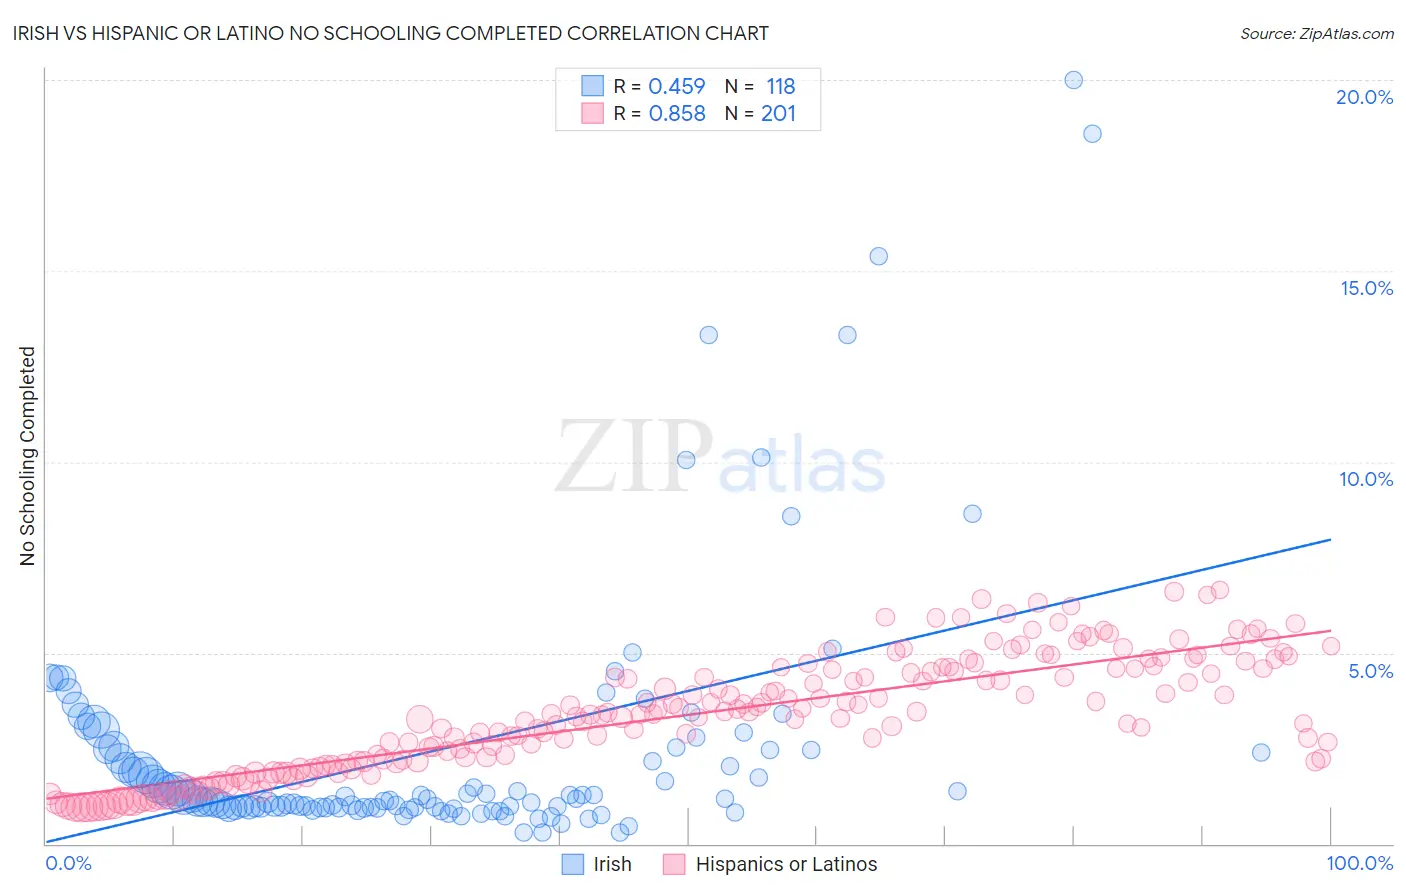
Irish vs Hispanic or Latino No Schooling Completed Correlation Chart
The statistical analysis conducted on geographies consisting of 558,904,841 people shows a moderate positive correlation between the proportion of Irish and percentage of population with no schooling in the United States with a correlation coefficient (R) of 0.459 and weighted average of 1.4%. Similarly, the statistical analysis conducted on geographies consisting of 559,472,816 people shows a very strong positive correlation between the proportion of Hispanics or Latinos and percentage of population with no schooling in the United States with a correlation coefficient (R) of 0.858 and weighted average of 3.0%, a difference of 111.2%.
No Schooling Completed Correlation Summary
| Measurement | Irish | Hispanic or Latino |
| Minimum | 0.30% | 0.95% |
| Maximum | 20.0% | 6.6% |
| Range | 19.7% | 5.7% |
| Mean | 2.5% | 3.4% |
| Median | 1.2% | 3.4% |
| Interquartile 25% (IQ1) | 0.96% | 2.1% |
| Interquartile 75% (IQ3) | 2.5% | 4.6% |
| Interquartile Range (IQR) | 1.5% | 2.5% |
| Standard Deviation (Sample) | 3.4% | 1.5% |
| Standard Deviation (Population) | 3.4% | 1.5% |
Similar Demographics by No Schooling Completed
Demographics Similar to Irish by No Schooling Completed
In terms of no schooling completed, the demographic groups most similar to Irish are Lithuanian (1.4%, a difference of 0.030%), Polish (1.4%, a difference of 0.030%), Dutch (1.4%, a difference of 0.86%), Scotch-Irish (1.5%, a difference of 0.97%), and Tlingit-Haida (1.5%, a difference of 1.0%).
| Demographics | Rating | Rank | No Schooling Completed |
| Slovenes | 100.0 /100 | #5 | Exceptional 1.4% |
| Carpatho Rusyns | 100.0 /100 | #6 | Exceptional 1.4% |
| English | 100.0 /100 | #7 | Exceptional 1.4% |
| Swedes | 100.0 /100 | #8 | Exceptional 1.4% |
| Scottish | 100.0 /100 | #9 | Exceptional 1.4% |
| Dutch | 100.0 /100 | #10 | Exceptional 1.4% |
| Lithuanians | 100.0 /100 | #11 | Exceptional 1.4% |
| Irish | 100.0 /100 | #12 | Exceptional 1.4% |
| Poles | 100.0 /100 | #13 | Exceptional 1.4% |
| Scotch-Irish | 100.0 /100 | #14 | Exceptional 1.5% |
| Tlingit-Haida | 100.0 /100 | #15 | Exceptional 1.5% |
| Finns | 100.0 /100 | #16 | Exceptional 1.5% |
| Croatians | 100.0 /100 | #17 | Exceptional 1.5% |
| Danes | 100.0 /100 | #18 | Exceptional 1.5% |
| Alaskan Athabascans | 100.0 /100 | #19 | Exceptional 1.5% |
Demographics Similar to Hispanics or Latinos by No Schooling Completed
In terms of no schooling completed, the demographic groups most similar to Hispanics or Latinos are Guyanese (3.0%, a difference of 0.050%), Immigrants from the Azores (3.0%, a difference of 0.15%), Sri Lankan (3.0%, a difference of 0.43%), Immigrants from Somalia (3.0%, a difference of 0.81%), and Honduran (3.1%, a difference of 0.94%).
| Demographics | Rating | Rank | No Schooling Completed |
| Immigrants | Caribbean | 0.0 /100 | #302 | Tragic 2.9% |
| Somalis | 0.0 /100 | #303 | Tragic 2.9% |
| Nicaraguans | 0.0 /100 | #304 | Tragic 2.9% |
| Ecuadorians | 0.0 /100 | #305 | Tragic 3.0% |
| Belizeans | 0.0 /100 | #306 | Tragic 3.0% |
| Immigrants | Haiti | 0.0 /100 | #307 | Tragic 3.0% |
| Immigrants | Somalia | 0.0 /100 | #308 | Tragic 3.0% |
| Hispanics or Latinos | 0.0 /100 | #309 | Tragic 3.0% |
| Guyanese | 0.0 /100 | #310 | Tragic 3.0% |
| Immigrants | Azores | 0.0 /100 | #311 | Tragic 3.0% |
| Sri Lankans | 0.0 /100 | #312 | Tragic 3.0% |
| Hondurans | 0.0 /100 | #313 | Tragic 3.1% |
| Immigrants | Belize | 0.0 /100 | #314 | Tragic 3.1% |
| Immigrants | Nicaragua | 0.0 /100 | #315 | Tragic 3.1% |
| Immigrants | Ecuador | 0.0 /100 | #316 | Tragic 3.1% |