Immigrants from Belize vs British GED/Equivalency
COMPARE
Immigrants from Belize
British
GED/Equivalency
GED/Equivalency Comparison
Immigrants from Belize
British
80.5%
GED/EQUIVALENCY
0.0/ 100
METRIC RATING
319th/ 347
METRIC RANK
87.8%
GED/EQUIVALENCY
99.1/ 100
METRIC RATING
67th/ 347
METRIC RANK
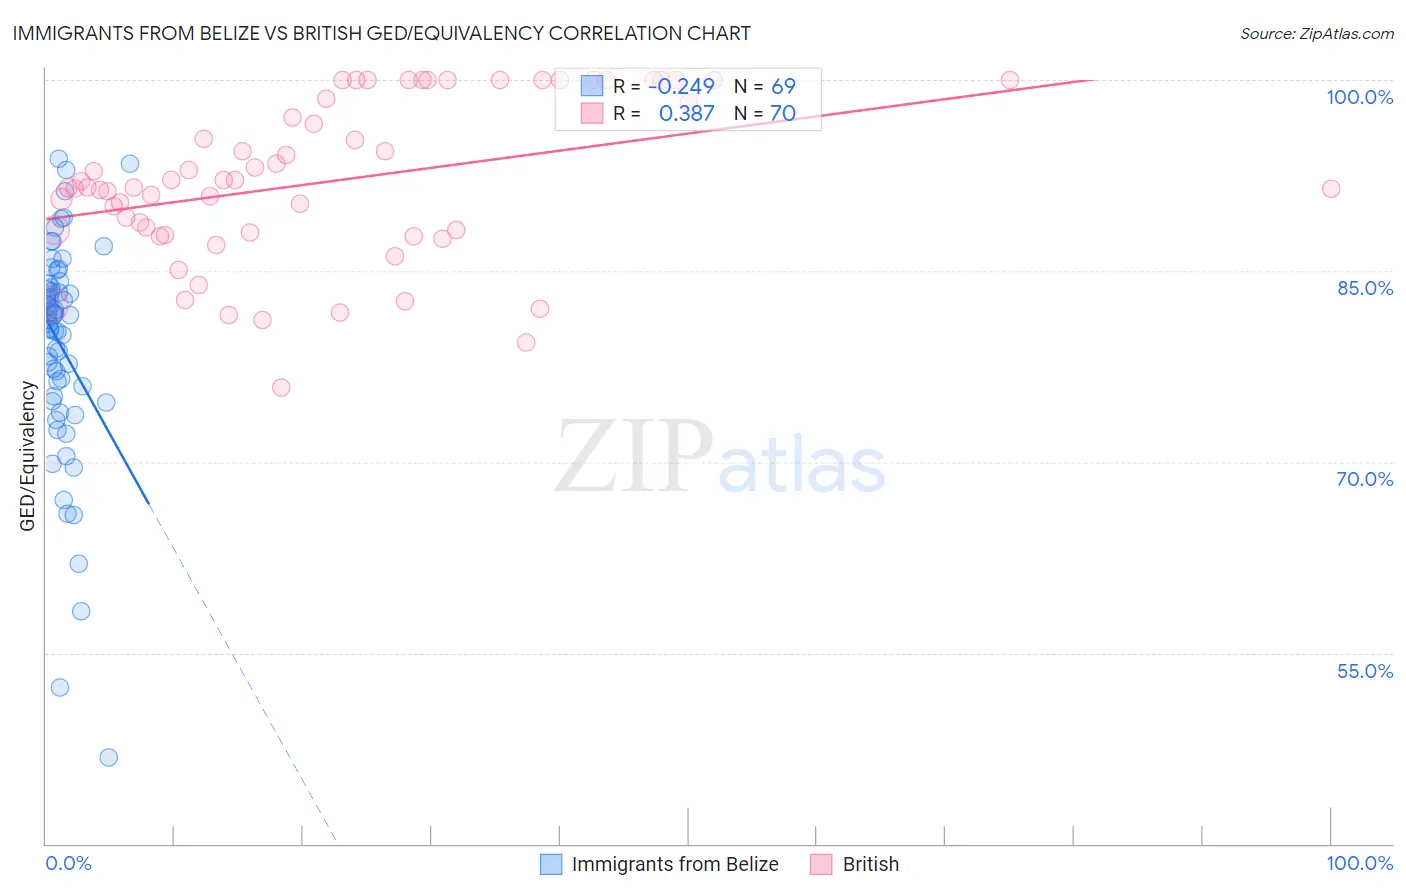
Immigrants from Belize vs British GED/Equivalency Correlation Chart
The statistical analysis conducted on geographies consisting of 130,250,151 people shows a weak negative correlation between the proportion of Immigrants from Belize and percentage of population with at least ged/equivalency education in the United States with a correlation coefficient (R) of -0.249 and weighted average of 80.5%. Similarly, the statistical analysis conducted on geographies consisting of 531,463,395 people shows a mild positive correlation between the proportion of British and percentage of population with at least ged/equivalency education in the United States with a correlation coefficient (R) of 0.387 and weighted average of 87.8%, a difference of 9.1%.
GED/Equivalency Correlation Summary
| Measurement | Immigrants from Belize | British |
| Minimum | 46.8% | 75.9% |
| Maximum | 93.8% | 100.0% |
| Range | 47.0% | 24.1% |
| Mean | 79.0% | 92.0% |
| Median | 81.2% | 91.5% |
| Interquartile 25% (IQ1) | 75.0% | 88.0% |
| Interquartile 75% (IQ3) | 83.8% | 98.6% |
| Interquartile Range (IQR) | 8.9% | 10.6% |
| Standard Deviation (Sample) | 8.8% | 6.3% |
| Standard Deviation (Population) | 8.7% | 6.2% |
Similar Demographics by GED/Equivalency
Demographics Similar to Immigrants from Belize by GED/Equivalency
In terms of ged/equivalency, the demographic groups most similar to Immigrants from Belize are Yaqui (80.5%, a difference of 0.0%), Immigrants from Caribbean (80.5%, a difference of 0.020%), Central American Indian (80.6%, a difference of 0.13%), Apache (80.7%, a difference of 0.26%), and Immigrants from Cuba (80.2%, a difference of 0.41%).
| Demographics | Rating | Rank | GED/Equivalency |
| Nicaraguans | 0.0 /100 | #312 | Tragic 80.9% |
| Cape Verdeans | 0.0 /100 | #313 | Tragic 80.9% |
| Belizeans | 0.0 /100 | #314 | Tragic 80.9% |
| Apache | 0.0 /100 | #315 | Tragic 80.7% |
| Central American Indians | 0.0 /100 | #316 | Tragic 80.6% |
| Immigrants | Caribbean | 0.0 /100 | #317 | Tragic 80.5% |
| Yaqui | 0.0 /100 | #318 | Tragic 80.5% |
| Immigrants | Belize | 0.0 /100 | #319 | Tragic 80.5% |
| Immigrants | Cuba | 0.0 /100 | #320 | Tragic 80.2% |
| Yup'ik | 0.0 /100 | #321 | Tragic 80.0% |
| Lumbee | 0.0 /100 | #322 | Tragic 80.0% |
| Immigrants | Nicaragua | 0.0 /100 | #323 | Tragic 79.9% |
| Mexican American Indians | 0.0 /100 | #324 | Tragic 79.4% |
| Hondurans | 0.0 /100 | #325 | Tragic 79.3% |
| Yuman | 0.0 /100 | #326 | Tragic 79.2% |
Demographics Similar to British by GED/Equivalency
In terms of ged/equivalency, the demographic groups most similar to British are Immigrants from France (87.8%, a difference of 0.0%), Immigrants from North America (87.8%, a difference of 0.010%), Immigrants from Bulgaria (87.8%, a difference of 0.010%), Immigrants from Canada (87.9%, a difference of 0.050%), and Immigrants from Saudi Arabia (87.8%, a difference of 0.070%).
| Demographics | Rating | Rank | GED/Equivalency |
| Scandinavians | 99.3 /100 | #60 | Exceptional 87.9% |
| Europeans | 99.3 /100 | #61 | Exceptional 87.9% |
| Germans | 99.3 /100 | #62 | Exceptional 87.9% |
| Immigrants | Turkey | 99.2 /100 | #63 | Exceptional 87.9% |
| Immigrants | Canada | 99.2 /100 | #64 | Exceptional 87.9% |
| Immigrants | North America | 99.1 /100 | #65 | Exceptional 87.8% |
| Immigrants | Bulgaria | 99.1 /100 | #66 | Exceptional 87.8% |
| British | 99.1 /100 | #67 | Exceptional 87.8% |
| Immigrants | France | 99.1 /100 | #68 | Exceptional 87.8% |
| Immigrants | Saudi Arabia | 99.0 /100 | #69 | Exceptional 87.8% |
| Ukrainians | 98.8 /100 | #70 | Exceptional 87.7% |
| Austrians | 98.8 /100 | #71 | Exceptional 87.7% |
| Immigrants | Moldova | 98.8 /100 | #72 | Exceptional 87.7% |
| Belgians | 98.8 /100 | #73 | Exceptional 87.7% |
| Immigrants | Kuwait | 98.8 /100 | #74 | Exceptional 87.7% |