Immigrants from Belize vs Immigrants from El Salvador GED/Equivalency
COMPARE
Immigrants from Belize
Immigrants from El Salvador
GED/Equivalency
GED/Equivalency Comparison
Immigrants from Belize
Immigrants from El Salvador
80.5%
GED/EQUIVALENCY
0.0/ 100
METRIC RATING
319th/ 347
METRIC RANK
77.6%
GED/EQUIVALENCY
0.0/ 100
METRIC RATING
339th/ 347
METRIC RANK
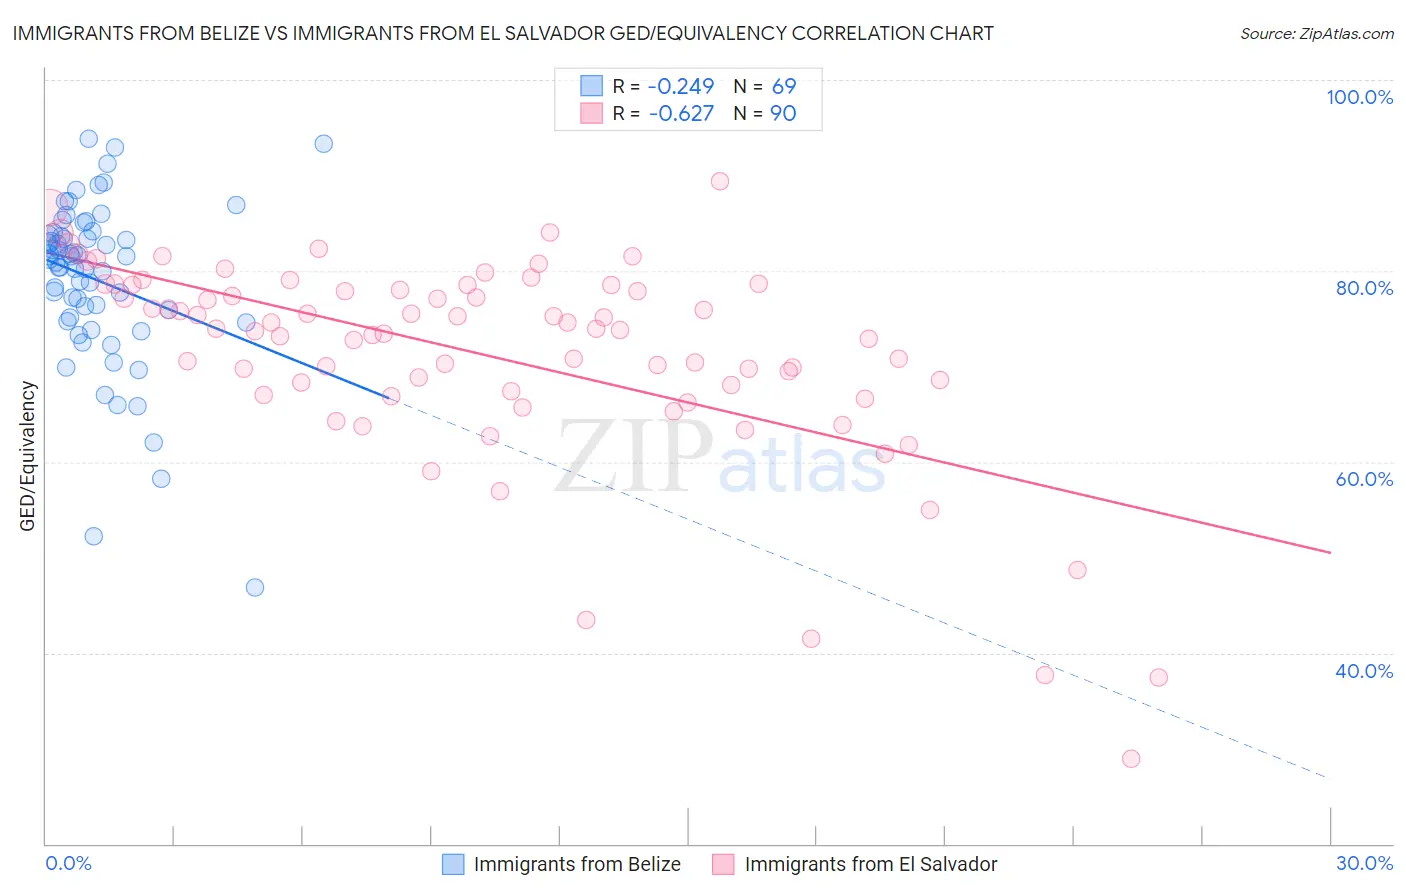
Immigrants from Belize vs Immigrants from El Salvador GED/Equivalency Correlation Chart
The statistical analysis conducted on geographies consisting of 130,250,151 people shows a weak negative correlation between the proportion of Immigrants from Belize and percentage of population with at least ged/equivalency education in the United States with a correlation coefficient (R) of -0.249 and weighted average of 80.5%. Similarly, the statistical analysis conducted on geographies consisting of 357,852,938 people shows a significant negative correlation between the proportion of Immigrants from El Salvador and percentage of population with at least ged/equivalency education in the United States with a correlation coefficient (R) of -0.627 and weighted average of 77.6%, a difference of 3.7%.
GED/Equivalency Correlation Summary
| Measurement | Immigrants from Belize | Immigrants from El Salvador |
| Minimum | 46.8% | 29.0% |
| Maximum | 93.8% | 89.4% |
| Range | 47.0% | 60.4% |
| Mean | 79.0% | 71.2% |
| Median | 81.2% | 73.8% |
| Interquartile 25% (IQ1) | 75.0% | 67.4% |
| Interquartile 75% (IQ3) | 83.8% | 78.5% |
| Interquartile Range (IQR) | 8.9% | 11.1% |
| Standard Deviation (Sample) | 8.8% | 10.9% |
| Standard Deviation (Population) | 8.7% | 10.8% |
Demographics Similar to Immigrants from Belize and Immigrants from El Salvador by GED/Equivalency
In terms of ged/equivalency, the demographic groups most similar to Immigrants from Belize are Immigrants from Cuba (80.2%, a difference of 0.41%), Yup'ik (80.0%, a difference of 0.58%), Lumbee (80.0%, a difference of 0.65%), Immigrants from Nicaragua (79.9%, a difference of 0.77%), and Mexican American Indian (79.4%, a difference of 1.4%). Similarly, the demographic groups most similar to Immigrants from El Salvador are Immigrants from Guatemala (77.9%, a difference of 0.38%), Immigrants from Yemen (77.9%, a difference of 0.41%), Immigrants from Dominican Republic (78.0%, a difference of 0.47%), Immigrants from Latin America (78.5%, a difference of 1.1%), and Guatemalan (78.5%, a difference of 1.1%).
| Demographics | Rating | Rank | GED/Equivalency |
| Immigrants | Belize | 0.0 /100 | #319 | Tragic 80.5% |
| Immigrants | Cuba | 0.0 /100 | #320 | Tragic 80.2% |
| Yup'ik | 0.0 /100 | #321 | Tragic 80.0% |
| Lumbee | 0.0 /100 | #322 | Tragic 80.0% |
| Immigrants | Nicaragua | 0.0 /100 | #323 | Tragic 79.9% |
| Mexican American Indians | 0.0 /100 | #324 | Tragic 79.4% |
| Hondurans | 0.0 /100 | #325 | Tragic 79.3% |
| Yuman | 0.0 /100 | #326 | Tragic 79.2% |
| Central Americans | 0.0 /100 | #327 | Tragic 79.2% |
| Hispanics or Latinos | 0.0 /100 | #328 | Tragic 79.1% |
| Dominicans | 0.0 /100 | #329 | Tragic 79.1% |
| Immigrants | Cabo Verde | 0.0 /100 | #330 | Tragic 78.9% |
| Immigrants | Honduras | 0.0 /100 | #331 | Tragic 78.7% |
| Immigrants | Azores | 0.0 /100 | #332 | Tragic 78.7% |
| Salvadorans | 0.0 /100 | #333 | Tragic 78.6% |
| Guatemalans | 0.0 /100 | #334 | Tragic 78.5% |
| Immigrants | Latin America | 0.0 /100 | #335 | Tragic 78.5% |
| Immigrants | Dominican Republic | 0.0 /100 | #336 | Tragic 78.0% |
| Immigrants | Yemen | 0.0 /100 | #337 | Tragic 77.9% |
| Immigrants | Guatemala | 0.0 /100 | #338 | Tragic 77.9% |
| Immigrants | El Salvador | 0.0 /100 | #339 | Tragic 77.6% |