Immigrants from Cabo Verde vs Immigrants from Zaire College, Under 1 year
COMPARE
Immigrants from Cabo Verde
Immigrants from Zaire
College, Under 1 year
College, Under 1 year Comparison
Immigrants from Cabo Verde
Immigrants from Zaire
53.7%
COLLEGE, UNDER 1 YEAR
0.0/ 100
METRIC RATING
341st/ 347
METRIC RANK
64.1%
COLLEGE, UNDER 1 YEAR
14.6/ 100
METRIC RATING
204th/ 347
METRIC RANK
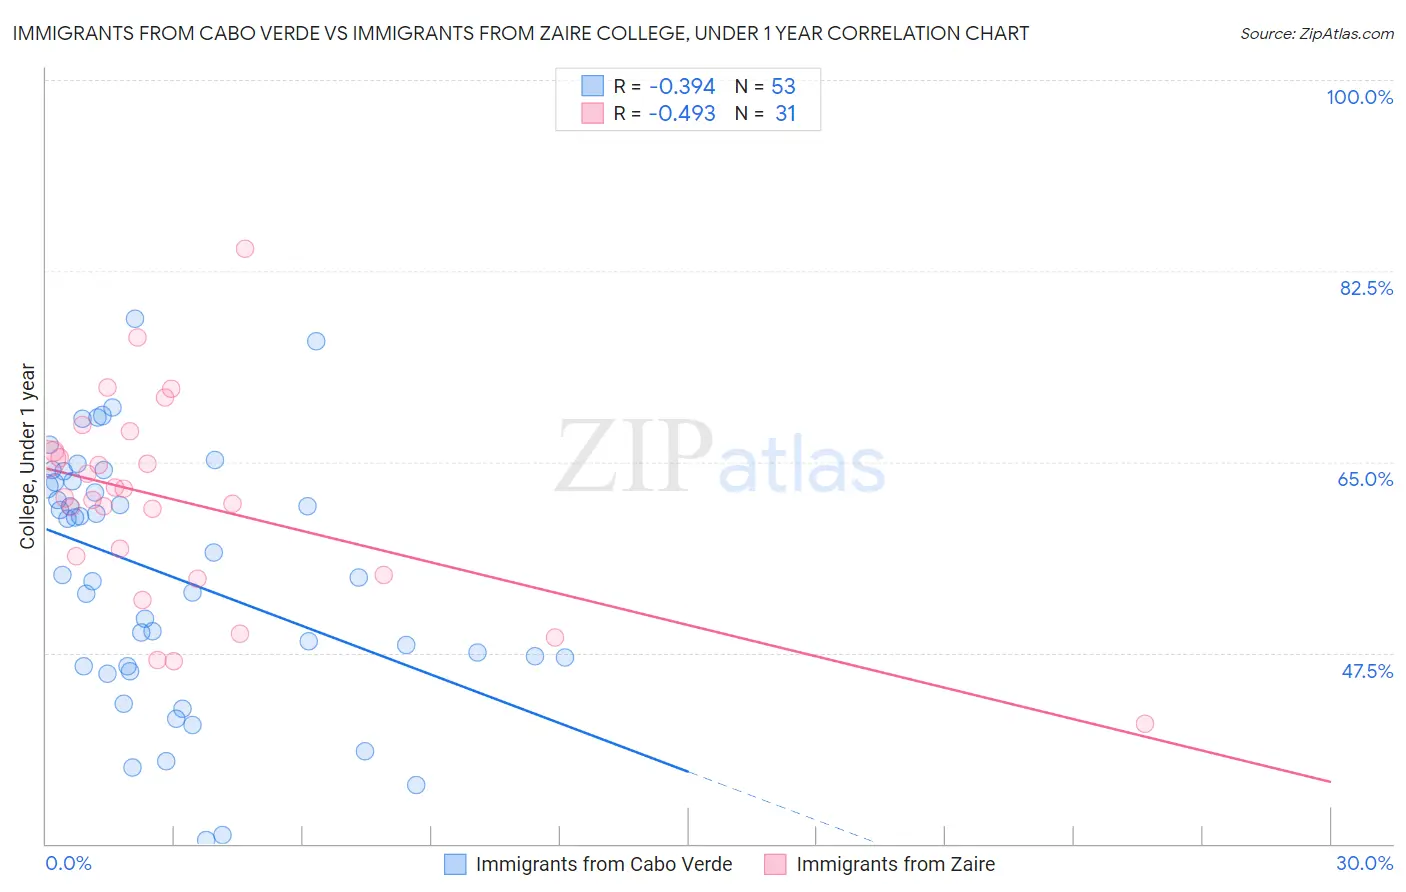
Immigrants from Cabo Verde vs Immigrants from Zaire College, Under 1 year Correlation Chart
The statistical analysis conducted on geographies consisting of 38,158,666 people shows a mild negative correlation between the proportion of Immigrants from Cabo Verde and percentage of population with at least college, under 1 year education in the United States with a correlation coefficient (R) of -0.394 and weighted average of 53.7%. Similarly, the statistical analysis conducted on geographies consisting of 107,255,700 people shows a moderate negative correlation between the proportion of Immigrants from Zaire and percentage of population with at least college, under 1 year education in the United States with a correlation coefficient (R) of -0.493 and weighted average of 64.1%, a difference of 19.5%.
College, Under 1 year Correlation Summary
| Measurement | Immigrants from Cabo Verde | Immigrants from Zaire |
| Minimum | 30.4% | 41.0% |
| Maximum | 78.2% | 84.6% |
| Range | 47.8% | 43.5% |
| Mean | 54.6% | 61.3% |
| Median | 54.6% | 61.7% |
| Interquartile 25% (IQ1) | 46.2% | 54.7% |
| Interquartile 75% (IQ3) | 63.1% | 66.0% |
| Interquartile Range (IQR) | 16.9% | 11.3% |
| Standard Deviation (Sample) | 11.4% | 9.3% |
| Standard Deviation (Population) | 11.3% | 9.2% |
Similar Demographics by College, Under 1 year
Demographics Similar to Immigrants from Cabo Verde by College, Under 1 year
In terms of college, under 1 year, the demographic groups most similar to Immigrants from Cabo Verde are Immigrants from Mexico (53.7%, a difference of 0.060%), Spanish American Indian (54.0%, a difference of 0.51%), Immigrants from Dominican Republic (54.0%, a difference of 0.59%), Lumbee (54.2%, a difference of 1.0%), and Immigrants from Central America (54.4%, a difference of 1.4%).
| Demographics | Rating | Rank | College, Under 1 year |
| Yuman | 0.0 /100 | #333 | Tragic 55.1% |
| Immigrants | Azores | 0.0 /100 | #334 | Tragic 54.7% |
| Inupiat | 0.0 /100 | #335 | Tragic 54.6% |
| Pennsylvania Germans | 0.0 /100 | #336 | Tragic 54.5% |
| Immigrants | Central America | 0.0 /100 | #337 | Tragic 54.4% |
| Lumbee | 0.0 /100 | #338 | Tragic 54.2% |
| Immigrants | Dominican Republic | 0.0 /100 | #339 | Tragic 54.0% |
| Spanish American Indians | 0.0 /100 | #340 | Tragic 54.0% |
| Immigrants | Cabo Verde | 0.0 /100 | #341 | Tragic 53.7% |
| Immigrants | Mexico | 0.0 /100 | #342 | Tragic 53.7% |
| Tohono O'odham | 0.0 /100 | #343 | Tragic 52.8% |
| Yakama | 0.0 /100 | #344 | Tragic 52.6% |
| Pima | 0.0 /100 | #345 | Tragic 51.4% |
| Houma | 0.0 /100 | #346 | Tragic 47.6% |
| Yup'ik | 0.0 /100 | #347 | Tragic 45.8% |
Demographics Similar to Immigrants from Zaire by College, Under 1 year
In terms of college, under 1 year, the demographic groups most similar to Immigrants from Zaire are Peruvian (64.1%, a difference of 0.080%), Uruguayan (64.2%, a difference of 0.090%), French Canadian (64.2%, a difference of 0.14%), South American (64.2%, a difference of 0.14%), and White/Caucasian (64.0%, a difference of 0.17%).
| Demographics | Rating | Rank | College, Under 1 year |
| Costa Ricans | 19.6 /100 | #197 | Poor 64.4% |
| Tsimshian | 17.9 /100 | #198 | Poor 64.3% |
| Panamanians | 17.0 /100 | #199 | Poor 64.3% |
| Nigerians | 16.7 /100 | #200 | Poor 64.3% |
| French Canadians | 16.3 /100 | #201 | Poor 64.2% |
| South Americans | 16.2 /100 | #202 | Poor 64.2% |
| Uruguayans | 15.6 /100 | #203 | Poor 64.2% |
| Immigrants | Zaire | 14.6 /100 | #204 | Poor 64.1% |
| Peruvians | 13.7 /100 | #205 | Poor 64.1% |
| Whites/Caucasians | 12.8 /100 | #206 | Poor 64.0% |
| Colombians | 12.4 /100 | #207 | Poor 64.0% |
| Immigrants | Vietnam | 12.1 /100 | #208 | Poor 64.0% |
| Puget Sound Salish | 11.3 /100 | #209 | Poor 63.9% |
| Ghanaians | 11.2 /100 | #210 | Poor 63.9% |
| Native Hawaiians | 10.6 /100 | #211 | Poor 63.9% |