Chilean vs Immigrants from Japan College, Under 1 year
COMPARE
Chilean
Immigrants from Japan
College, Under 1 year
College, Under 1 year Comparison
Chileans
Immigrants from Japan
67.6%
COLLEGE, UNDER 1 YEAR
95.3/ 100
METRIC RATING
114th/ 347
METRIC RANK
71.9%
COLLEGE, UNDER 1 YEAR
100.0/ 100
METRIC RATING
16th/ 347
METRIC RANK
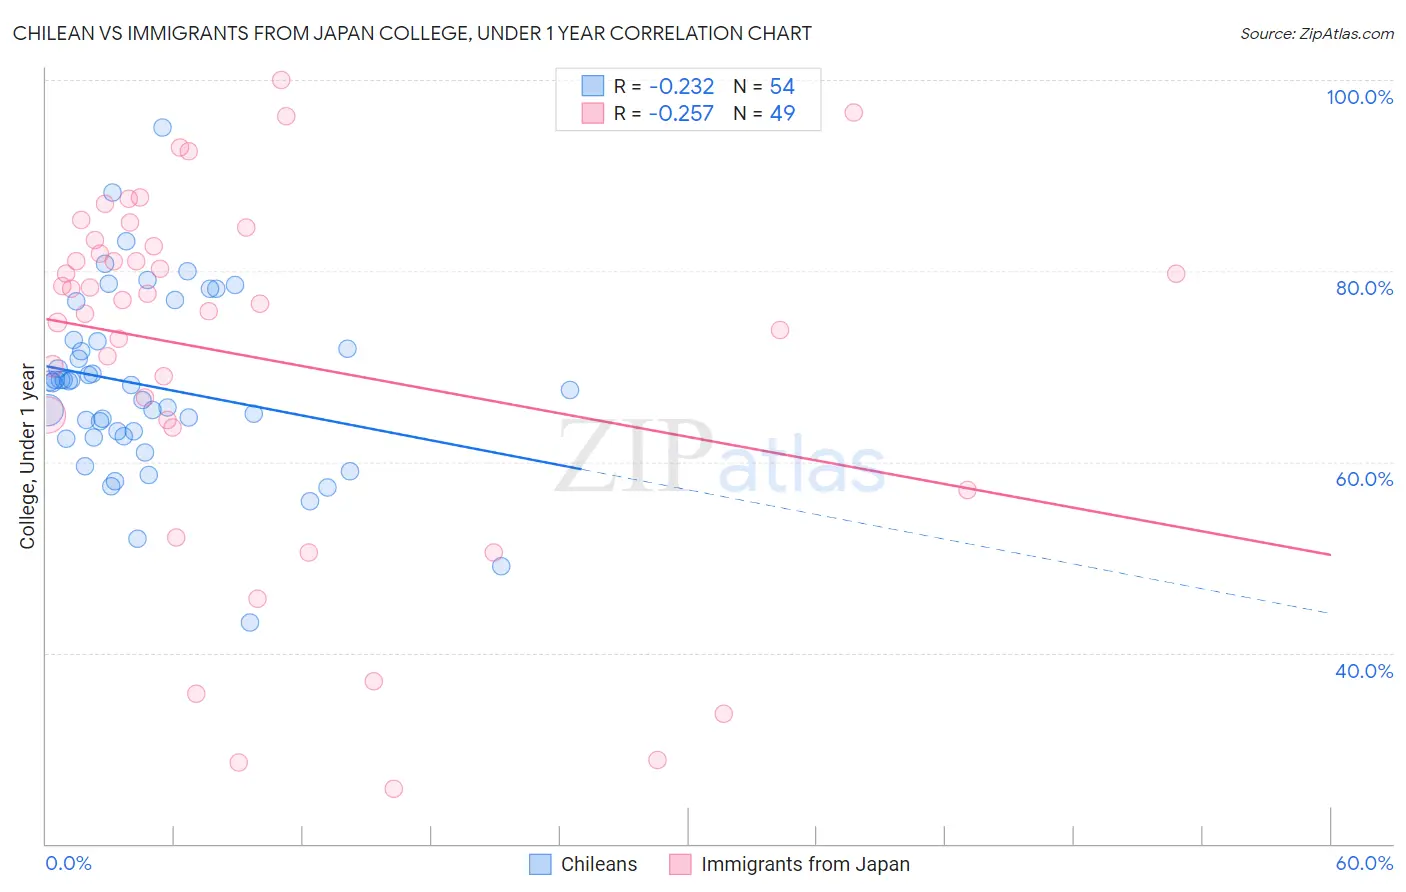
Chilean vs Immigrants from Japan College, Under 1 year Correlation Chart
The statistical analysis conducted on geographies consisting of 256,681,764 people shows a weak negative correlation between the proportion of Chileans and percentage of population with at least college, under 1 year education in the United States with a correlation coefficient (R) of -0.232 and weighted average of 67.6%. Similarly, the statistical analysis conducted on geographies consisting of 340,148,871 people shows a weak negative correlation between the proportion of Immigrants from Japan and percentage of population with at least college, under 1 year education in the United States with a correlation coefficient (R) of -0.257 and weighted average of 71.9%, a difference of 6.3%.
College, Under 1 year Correlation Summary
| Measurement | Chilean | Immigrants from Japan |
| Minimum | 43.2% | 25.7% |
| Maximum | 95.0% | 100.0% |
| Range | 51.9% | 74.3% |
| Mean | 67.9% | 71.0% |
| Median | 68.2% | 76.9% |
| Interquartile 25% (IQ1) | 62.7% | 64.0% |
| Interquartile 75% (IQ3) | 72.6% | 82.9% |
| Interquartile Range (IQR) | 10.0% | 19.0% |
| Standard Deviation (Sample) | 9.4% | 19.0% |
| Standard Deviation (Population) | 9.3% | 18.8% |
Similar Demographics by College, Under 1 year
Demographics Similar to Chileans by College, Under 1 year
In terms of college, under 1 year, the demographic groups most similar to Chileans are Basque (67.6%, a difference of 0.010%), Syrian (67.6%, a difference of 0.080%), Immigrants from Nepal (67.5%, a difference of 0.090%), Macedonian (67.6%, a difference of 0.10%), and Pakistani (67.5%, a difference of 0.11%).
| Demographics | Rating | Rank | College, Under 1 year |
| Austrians | 96.4 /100 | #107 | Exceptional 67.8% |
| Immigrants | Egypt | 96.0 /100 | #108 | Exceptional 67.7% |
| Scandinavians | 95.8 /100 | #109 | Exceptional 67.7% |
| Assyrians/Chaldeans/Syriacs | 95.8 /100 | #110 | Exceptional 67.7% |
| Ukrainians | 95.8 /100 | #111 | Exceptional 67.7% |
| Macedonians | 95.7 /100 | #112 | Exceptional 67.6% |
| Syrians | 95.6 /100 | #113 | Exceptional 67.6% |
| Chileans | 95.3 /100 | #114 | Exceptional 67.6% |
| Basques | 95.2 /100 | #115 | Exceptional 67.6% |
| Immigrants | Nepal | 94.9 /100 | #116 | Exceptional 67.5% |
| Pakistanis | 94.8 /100 | #117 | Exceptional 67.5% |
| Immigrants | Ukraine | 94.7 /100 | #118 | Exceptional 67.5% |
| Lebanese | 94.6 /100 | #119 | Exceptional 67.5% |
| Serbians | 93.9 /100 | #120 | Exceptional 67.4% |
| Slovenes | 93.3 /100 | #121 | Exceptional 67.3% |
Demographics Similar to Immigrants from Japan by College, Under 1 year
In terms of college, under 1 year, the demographic groups most similar to Immigrants from Japan are Cambodian (71.9%, a difference of 0.010%), Burmese (71.9%, a difference of 0.010%), Cypriot (72.0%, a difference of 0.13%), Eastern European (71.8%, a difference of 0.14%), and Immigrants from Switzerland (71.7%, a difference of 0.28%).
| Demographics | Rating | Rank | College, Under 1 year |
| Immigrants | Australia | 100.0 /100 | #9 | Exceptional 72.7% |
| Immigrants | Israel | 100.0 /100 | #10 | Exceptional 72.3% |
| Immigrants | South Central Asia | 100.0 /100 | #11 | Exceptional 72.1% |
| Immigrants | Sweden | 100.0 /100 | #12 | Exceptional 72.1% |
| Cypriots | 100.0 /100 | #13 | Exceptional 72.0% |
| Cambodians | 100.0 /100 | #14 | Exceptional 71.9% |
| Burmese | 100.0 /100 | #15 | Exceptional 71.9% |
| Immigrants | Japan | 100.0 /100 | #16 | Exceptional 71.9% |
| Eastern Europeans | 100.0 /100 | #17 | Exceptional 71.8% |
| Immigrants | Switzerland | 100.0 /100 | #18 | Exceptional 71.7% |
| Latvians | 100.0 /100 | #19 | Exceptional 71.6% |
| Immigrants | Korea | 100.0 /100 | #20 | Exceptional 71.6% |
| Immigrants | Belgium | 100.0 /100 | #21 | Exceptional 71.5% |
| Immigrants | Eastern Asia | 100.0 /100 | #22 | Exceptional 71.3% |
| Immigrants | Northern Europe | 100.0 /100 | #23 | Exceptional 71.1% |