Immigrants from Bahamas vs Immigrants from Japan Unemployment Among Youth under 25 years
COMPARE
Immigrants from Bahamas
Immigrants from Japan
Unemployment Among Youth under 25 years
Unemployment Among Youth under 25 years Comparison
Immigrants from Bahamas
Immigrants from Japan
12.9%
UNEMPLOYMENT AMONG YOUTH UNDER 25 YEARS
0.0/ 100
METRIC RATING
271st/ 347
METRIC RANK
11.2%
UNEMPLOYMENT AMONG YOUTH UNDER 25 YEARS
95.5/ 100
METRIC RATING
89th/ 347
METRIC RANK
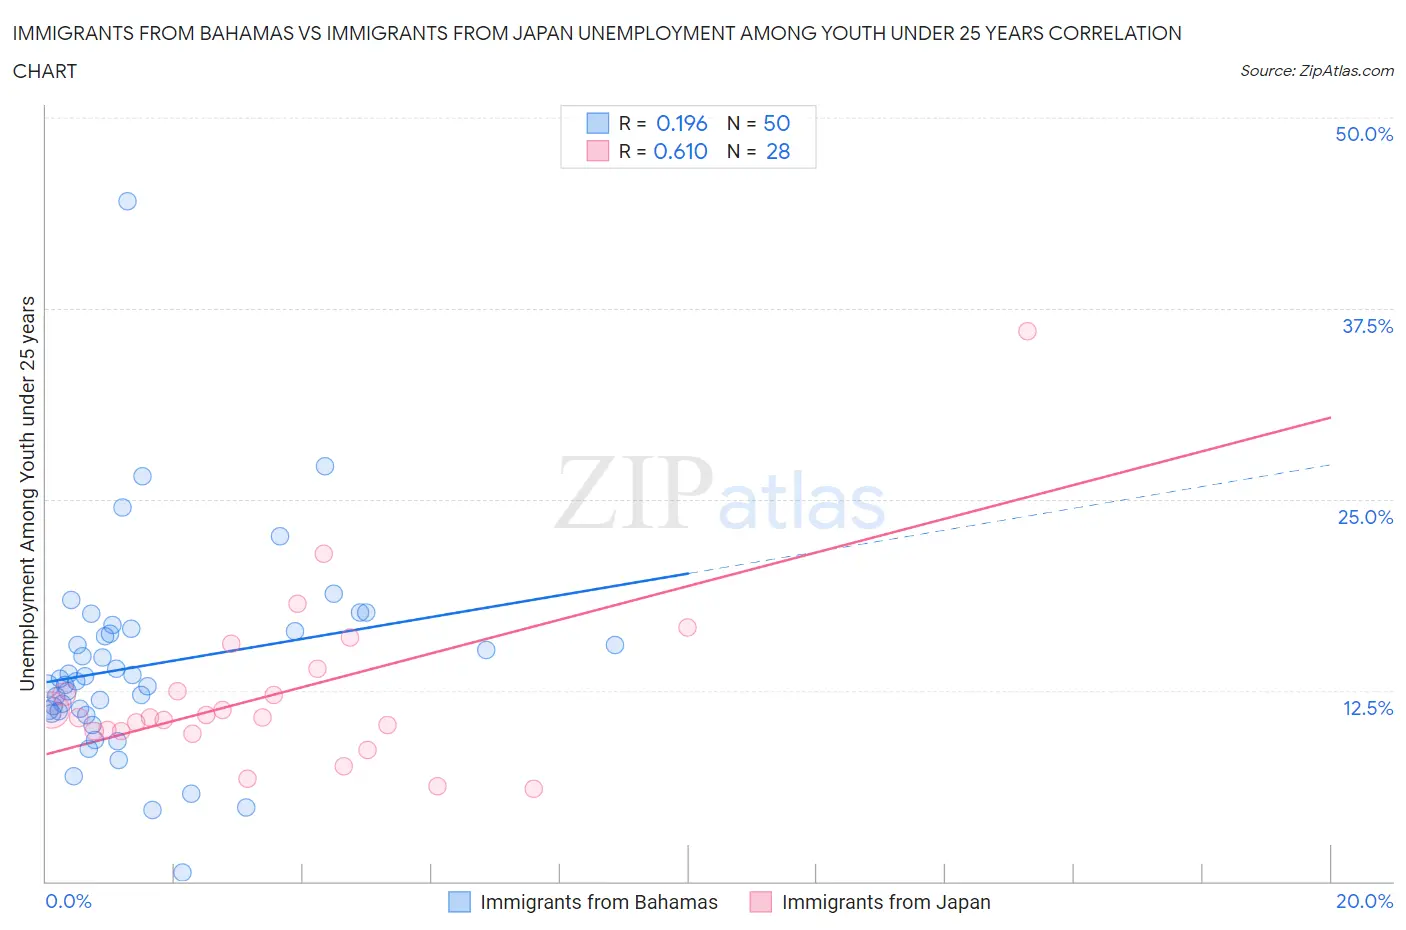
Immigrants from Bahamas vs Immigrants from Japan Unemployment Among Youth under 25 years Correlation Chart
The statistical analysis conducted on geographies consisting of 104,451,024 people shows a poor positive correlation between the proportion of Immigrants from Bahamas and unemployment rate among youth under the age of 25 in the United States with a correlation coefficient (R) of 0.196 and weighted average of 12.9%. Similarly, the statistical analysis conducted on geographies consisting of 337,330,907 people shows a significant positive correlation between the proportion of Immigrants from Japan and unemployment rate among youth under the age of 25 in the United States with a correlation coefficient (R) of 0.610 and weighted average of 11.2%, a difference of 14.6%.
Unemployment Among Youth under 25 years Correlation Summary
| Measurement | Immigrants from Bahamas | Immigrants from Japan |
| Minimum | 0.60% | 6.0% |
| Maximum | 44.5% | 36.0% |
| Range | 43.9% | 30.0% |
| Mean | 14.1% | 12.3% |
| Median | 13.2% | 10.7% |
| Interquartile 25% (IQ1) | 11.1% | 9.8% |
| Interquartile 75% (IQ3) | 16.4% | 13.2% |
| Interquartile Range (IQR) | 5.3% | 3.4% |
| Standard Deviation (Sample) | 6.7% | 5.8% |
| Standard Deviation (Population) | 6.7% | 5.7% |
Similar Demographics by Unemployment Among Youth under 25 years
Demographics Similar to Immigrants from Bahamas by Unemployment Among Youth under 25 years
In terms of unemployment among youth under 25 years, the demographic groups most similar to Immigrants from Bahamas are Cape Verdean (12.9%, a difference of 0.22%), Immigrants from Liberia (12.8%, a difference of 0.53%), Nigerian (13.0%, a difference of 0.57%), Immigrants from Nigeria (13.0%, a difference of 1.1%), and Bermudan (13.0%, a difference of 1.3%).
| Demographics | Rating | Rank | Unemployment Among Youth under 25 years |
| Puget Sound Salish | 0.1 /100 | #264 | Tragic 12.5% |
| Nepalese | 0.0 /100 | #265 | Tragic 12.5% |
| Immigrants | Latin America | 0.0 /100 | #266 | Tragic 12.6% |
| Sub-Saharan Africans | 0.0 /100 | #267 | Tragic 12.6% |
| Tlingit-Haida | 0.0 /100 | #268 | Tragic 12.7% |
| Kiowa | 0.0 /100 | #269 | Tragic 12.7% |
| Immigrants | Liberia | 0.0 /100 | #270 | Tragic 12.8% |
| Immigrants | Bahamas | 0.0 /100 | #271 | Tragic 12.9% |
| Cape Verdeans | 0.0 /100 | #272 | Tragic 12.9% |
| Nigerians | 0.0 /100 | #273 | Tragic 13.0% |
| Immigrants | Nigeria | 0.0 /100 | #274 | Tragic 13.0% |
| Bermudans | 0.0 /100 | #275 | Tragic 13.0% |
| Immigrants | Uzbekistan | 0.0 /100 | #276 | Tragic 13.1% |
| Bahamians | 0.0 /100 | #277 | Tragic 13.1% |
| Africans | 0.0 /100 | #278 | Tragic 13.2% |
Demographics Similar to Immigrants from Japan by Unemployment Among Youth under 25 years
In terms of unemployment among youth under 25 years, the demographic groups most similar to Immigrants from Japan are Austrian (11.2%, a difference of 0.0%), Immigrants from Bolivia (11.2%, a difference of 0.010%), Kenyan (11.2%, a difference of 0.060%), Immigrants from South Africa (11.2%, a difference of 0.070%), and Immigrants from Taiwan (11.2%, a difference of 0.090%).
| Demographics | Rating | Rank | Unemployment Among Youth under 25 years |
| Northern Europeans | 96.2 /100 | #82 | Exceptional 11.2% |
| Bolivians | 96.1 /100 | #83 | Exceptional 11.2% |
| French Canadians | 95.9 /100 | #84 | Exceptional 11.2% |
| Immigrants | South Central Asia | 95.9 /100 | #85 | Exceptional 11.2% |
| Immigrants | South Africa | 95.8 /100 | #86 | Exceptional 11.2% |
| Kenyans | 95.7 /100 | #87 | Exceptional 11.2% |
| Austrians | 95.5 /100 | #88 | Exceptional 11.2% |
| Immigrants | Japan | 95.5 /100 | #89 | Exceptional 11.2% |
| Immigrants | Bolivia | 95.5 /100 | #90 | Exceptional 11.2% |
| Immigrants | Taiwan | 95.1 /100 | #91 | Exceptional 11.2% |
| Immigrants | Latvia | 95.1 /100 | #92 | Exceptional 11.2% |
| Immigrants | North America | 95.1 /100 | #93 | Exceptional 11.2% |
| Lithuanians | 94.8 /100 | #94 | Exceptional 11.3% |
| Carpatho Rusyns | 94.4 /100 | #95 | Exceptional 11.3% |
| Immigrants | Serbia | 94.4 /100 | #96 | Exceptional 11.3% |