Immigrants from Armenia vs Yaqui Disability Age 65 to 74
COMPARE
Immigrants from Armenia
Yaqui
Disability Age 65 to 74
Disability Age 65 to 74 Comparison
Immigrants from Armenia
Yaqui
28.0%
DISABILITY AGE 65 TO 74
0.0/ 100
METRIC RATING
317th/ 347
METRIC RANK
27.4%
DISABILITY AGE 65 TO 74
0.0/ 100
METRIC RATING
309th/ 347
METRIC RANK
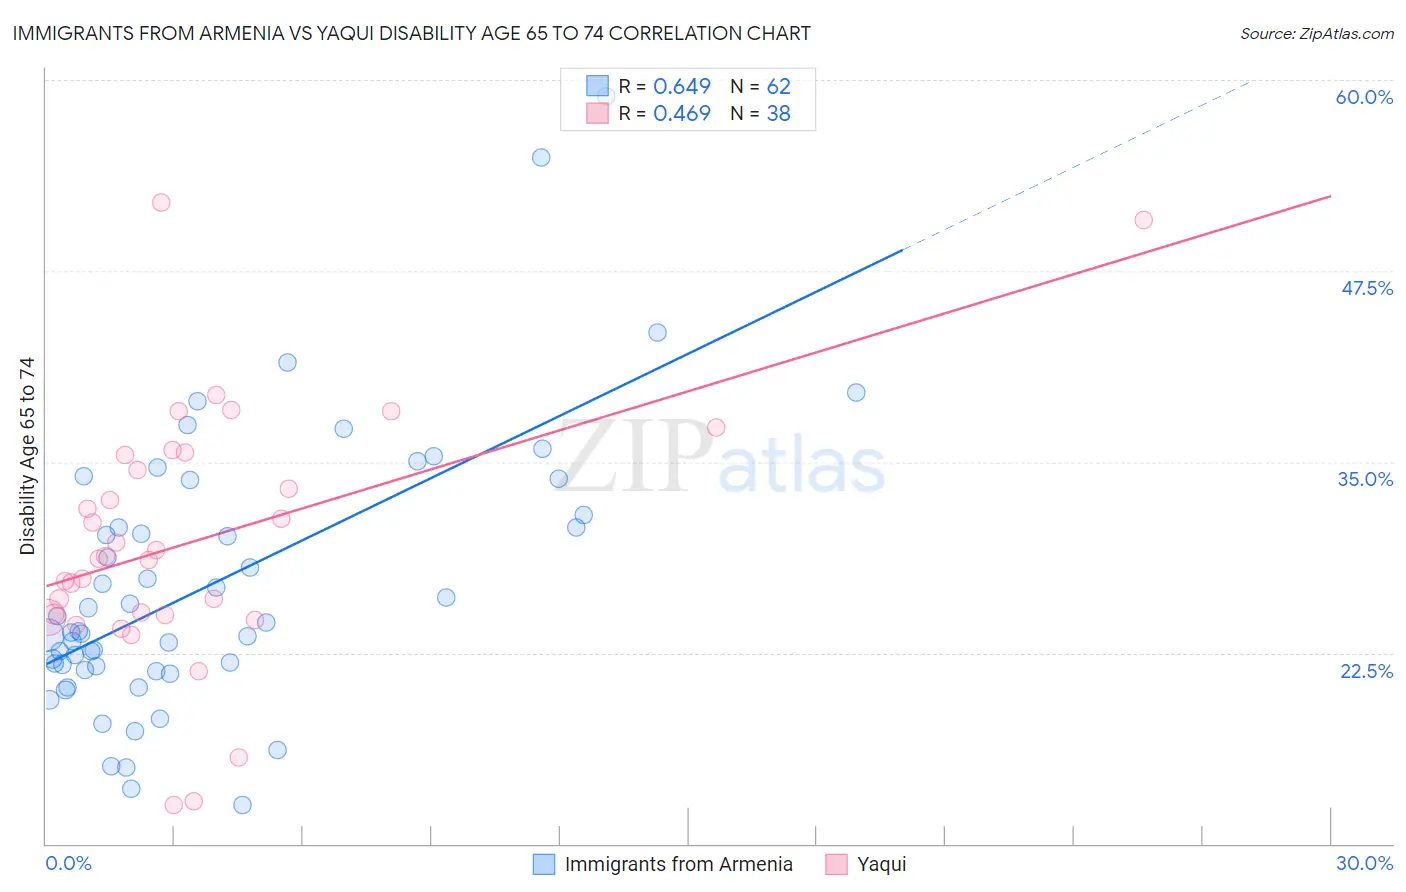
Immigrants from Armenia vs Yaqui Disability Age 65 to 74 Correlation Chart
The statistical analysis conducted on geographies consisting of 97,686,612 people shows a significant positive correlation between the proportion of Immigrants from Armenia and percentage of population with a disability between the ages 65 and 75 in the United States with a correlation coefficient (R) of 0.649 and weighted average of 28.0%. Similarly, the statistical analysis conducted on geographies consisting of 107,674,175 people shows a moderate positive correlation between the proportion of Yaqui and percentage of population with a disability between the ages 65 and 75 in the United States with a correlation coefficient (R) of 0.469 and weighted average of 27.4%, a difference of 2.2%.
Disability Age 65 to 74 Correlation Summary
| Measurement | Immigrants from Armenia | Yaqui |
| Minimum | 12.5% | 12.5% |
| Maximum | 59.0% | 52.0% |
| Range | 46.5% | 39.5% |
| Mean | 27.0% | 29.8% |
| Median | 24.2% | 28.7% |
| Interquartile 25% (IQ1) | 21.6% | 25.0% |
| Interquartile 75% (IQ3) | 31.5% | 35.4% |
| Interquartile Range (IQR) | 9.9% | 10.4% |
| Standard Deviation (Sample) | 9.0% | 8.4% |
| Standard Deviation (Population) | 8.9% | 8.2% |
Demographics Similar to Immigrants from Armenia and Yaqui by Disability Age 65 to 74
In terms of disability age 65 to 74, the demographic groups most similar to Immigrants from Armenia are Crow (27.9%, a difference of 0.090%), Cajun (27.9%, a difference of 0.13%), Nepalese (28.0%, a difference of 0.22%), Arapaho (28.1%, a difference of 0.45%), and Chippewa (27.8%, a difference of 0.60%). Similarly, the demographic groups most similar to Yaqui are Shoshone (27.4%, a difference of 0.050%), Sioux (27.3%, a difference of 0.060%), Ute (27.3%, a difference of 0.21%), Black/African American (27.3%, a difference of 0.27%), and Menominee (27.4%, a difference of 0.27%).
| Demographics | Rating | Rank | Disability Age 65 to 74 |
| Tlingit-Haida | 0.0 /100 | #303 | Tragic 27.1% |
| Puget Sound Salish | 0.0 /100 | #304 | Tragic 27.2% |
| Mexicans | 0.0 /100 | #305 | Tragic 27.2% |
| Blacks/African Americans | 0.0 /100 | #306 | Tragic 27.3% |
| Ute | 0.0 /100 | #307 | Tragic 27.3% |
| Sioux | 0.0 /100 | #308 | Tragic 27.3% |
| Yaqui | 0.0 /100 | #309 | Tragic 27.4% |
| Shoshone | 0.0 /100 | #310 | Tragic 27.4% |
| Menominee | 0.0 /100 | #311 | Tragic 27.4% |
| Osage | 0.0 /100 | #312 | Tragic 27.5% |
| Paiute | 0.0 /100 | #313 | Tragic 27.8% |
| Chippewa | 0.0 /100 | #314 | Tragic 27.8% |
| Cajuns | 0.0 /100 | #315 | Tragic 27.9% |
| Crow | 0.0 /100 | #316 | Tragic 27.9% |
| Immigrants | Armenia | 0.0 /100 | #317 | Tragic 28.0% |
| Nepalese | 0.0 /100 | #318 | Tragic 28.0% |
| Arapaho | 0.0 /100 | #319 | Tragic 28.1% |
| Cherokee | 0.0 /100 | #320 | Tragic 28.2% |
| Comanche | 0.0 /100 | #321 | Tragic 28.3% |
| Aleuts | 0.0 /100 | #322 | Tragic 28.4% |
| Puerto Ricans | 0.0 /100 | #323 | Tragic 29.1% |