Ethiopian vs Yaqui GED/Equivalency
COMPARE
Ethiopian
Yaqui
GED/Equivalency
GED/Equivalency Comparison
Ethiopians
Yaqui
86.0%
GED/EQUIVALENCY
63.7/ 100
METRIC RATING
167th/ 347
METRIC RANK
80.5%
GED/EQUIVALENCY
0.0/ 100
METRIC RATING
318th/ 347
METRIC RANK
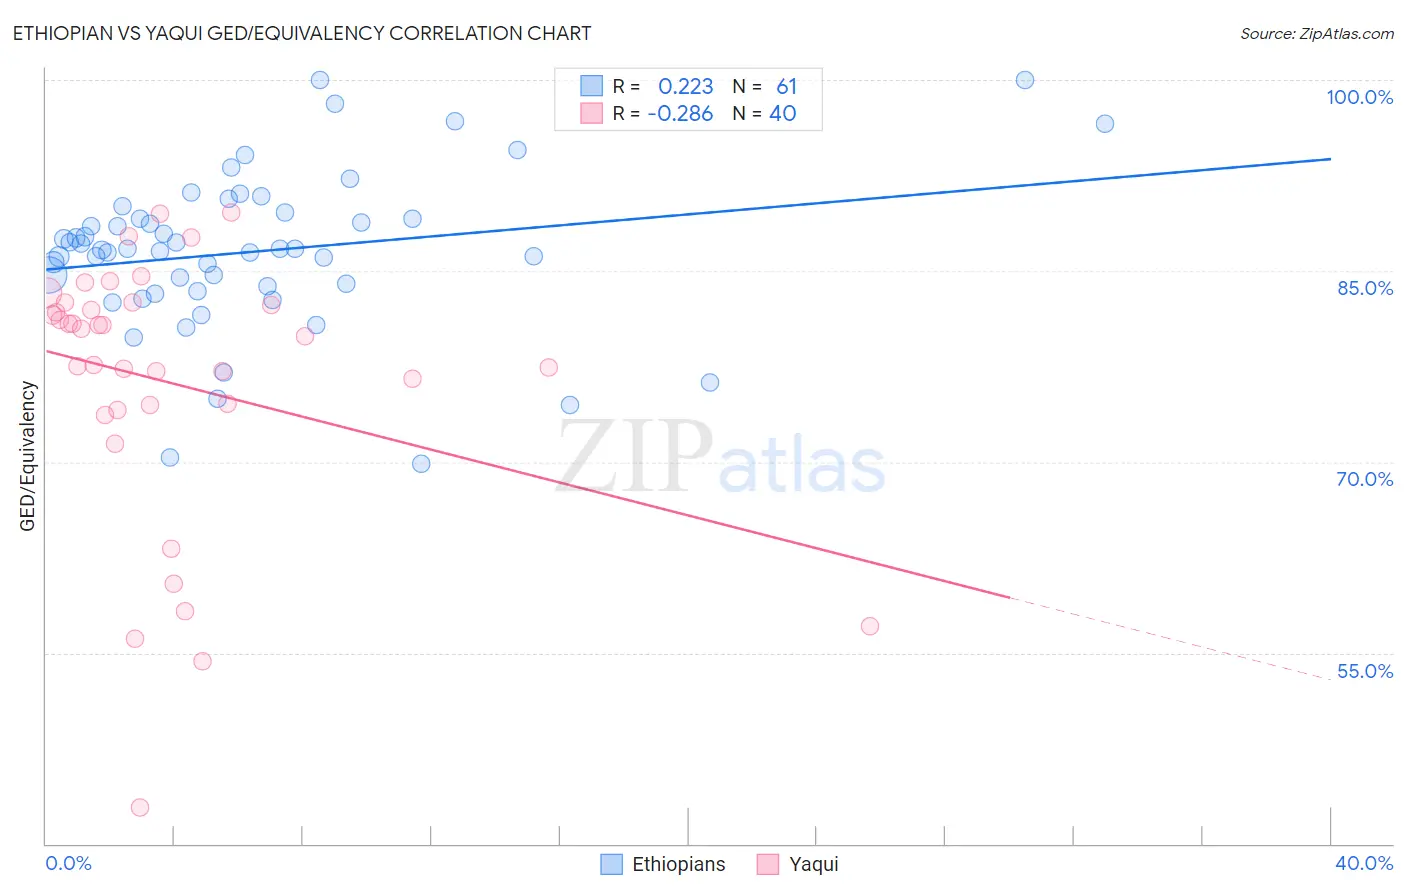
Ethiopian vs Yaqui GED/Equivalency Correlation Chart
The statistical analysis conducted on geographies consisting of 223,262,051 people shows a weak positive correlation between the proportion of Ethiopians and percentage of population with at least ged/equivalency education in the United States with a correlation coefficient (R) of 0.223 and weighted average of 86.0%. Similarly, the statistical analysis conducted on geographies consisting of 107,732,380 people shows a weak negative correlation between the proportion of Yaqui and percentage of population with at least ged/equivalency education in the United States with a correlation coefficient (R) of -0.286 and weighted average of 80.5%, a difference of 6.9%.
GED/Equivalency Correlation Summary
| Measurement | Ethiopian | Yaqui |
| Minimum | 69.8% | 42.9% |
| Maximum | 100.0% | 89.6% |
| Range | 30.2% | 46.7% |
| Mean | 86.5% | 76.2% |
| Median | 86.7% | 80.2% |
| Interquartile 25% (IQ1) | 83.6% | 74.3% |
| Interquartile 75% (IQ3) | 89.4% | 82.4% |
| Interquartile Range (IQR) | 5.7% | 8.1% |
| Standard Deviation (Sample) | 6.2% | 10.6% |
| Standard Deviation (Population) | 6.1% | 10.4% |
Similar Demographics by GED/Equivalency
Demographics Similar to Ethiopians by GED/Equivalency
In terms of ged/equivalency, the demographic groups most similar to Ethiopians are Alsatian (86.0%, a difference of 0.010%), Immigrants from Albania (86.0%, a difference of 0.010%), Venezuelan (86.0%, a difference of 0.040%), Sierra Leonean (86.0%, a difference of 0.040%), and Immigrants from Ethiopia (86.0%, a difference of 0.050%).
| Demographics | Rating | Rank | GED/Equivalency |
| Immigrants | Morocco | 69.5 /100 | #160 | Good 86.1% |
| Immigrants | Syria | 69.3 /100 | #161 | Good 86.1% |
| Immigrants | Iraq | 68.1 /100 | #162 | Good 86.1% |
| Ugandans | 66.3 /100 | #163 | Good 86.1% |
| Venezuelans | 65.5 /100 | #164 | Good 86.0% |
| Alsatians | 64.3 /100 | #165 | Good 86.0% |
| Immigrants | Albania | 64.2 /100 | #166 | Good 86.0% |
| Ethiopians | 63.7 /100 | #167 | Good 86.0% |
| Sierra Leoneans | 61.8 /100 | #168 | Good 86.0% |
| Immigrants | Ethiopia | 61.2 /100 | #169 | Good 86.0% |
| Afghans | 59.7 /100 | #170 | Average 85.9% |
| Immigrants | Chile | 57.3 /100 | #171 | Average 85.9% |
| Bermudans | 55.1 /100 | #172 | Average 85.8% |
| Immigrants | Venezuela | 50.7 /100 | #173 | Average 85.8% |
| Ottawa | 50.0 /100 | #174 | Average 85.8% |
Demographics Similar to Yaqui by GED/Equivalency
In terms of ged/equivalency, the demographic groups most similar to Yaqui are Immigrants from Belize (80.5%, a difference of 0.0%), Immigrants from Caribbean (80.5%, a difference of 0.020%), Central American Indian (80.6%, a difference of 0.13%), Apache (80.7%, a difference of 0.26%), and Immigrants from Cuba (80.2%, a difference of 0.41%).
| Demographics | Rating | Rank | GED/Equivalency |
| Natives/Alaskans | 0.0 /100 | #311 | Tragic 80.9% |
| Nicaraguans | 0.0 /100 | #312 | Tragic 80.9% |
| Cape Verdeans | 0.0 /100 | #313 | Tragic 80.9% |
| Belizeans | 0.0 /100 | #314 | Tragic 80.9% |
| Apache | 0.0 /100 | #315 | Tragic 80.7% |
| Central American Indians | 0.0 /100 | #316 | Tragic 80.6% |
| Immigrants | Caribbean | 0.0 /100 | #317 | Tragic 80.5% |
| Yaqui | 0.0 /100 | #318 | Tragic 80.5% |
| Immigrants | Belize | 0.0 /100 | #319 | Tragic 80.5% |
| Immigrants | Cuba | 0.0 /100 | #320 | Tragic 80.2% |
| Yup'ik | 0.0 /100 | #321 | Tragic 80.0% |
| Lumbee | 0.0 /100 | #322 | Tragic 80.0% |
| Immigrants | Nicaragua | 0.0 /100 | #323 | Tragic 79.9% |
| Mexican American Indians | 0.0 /100 | #324 | Tragic 79.4% |
| Hondurans | 0.0 /100 | #325 | Tragic 79.3% |