Immigrants from Uganda vs Spaniard GED/Equivalency
COMPARE
Immigrants from Uganda
Spaniard
GED/Equivalency
GED/Equivalency Comparison
Immigrants from Uganda
Spaniards
85.7%
GED/EQUIVALENCY
45.2/ 100
METRIC RATING
177th/ 347
METRIC RANK
85.4%
GED/EQUIVALENCY
31.9/ 100
METRIC RATING
186th/ 347
METRIC RANK
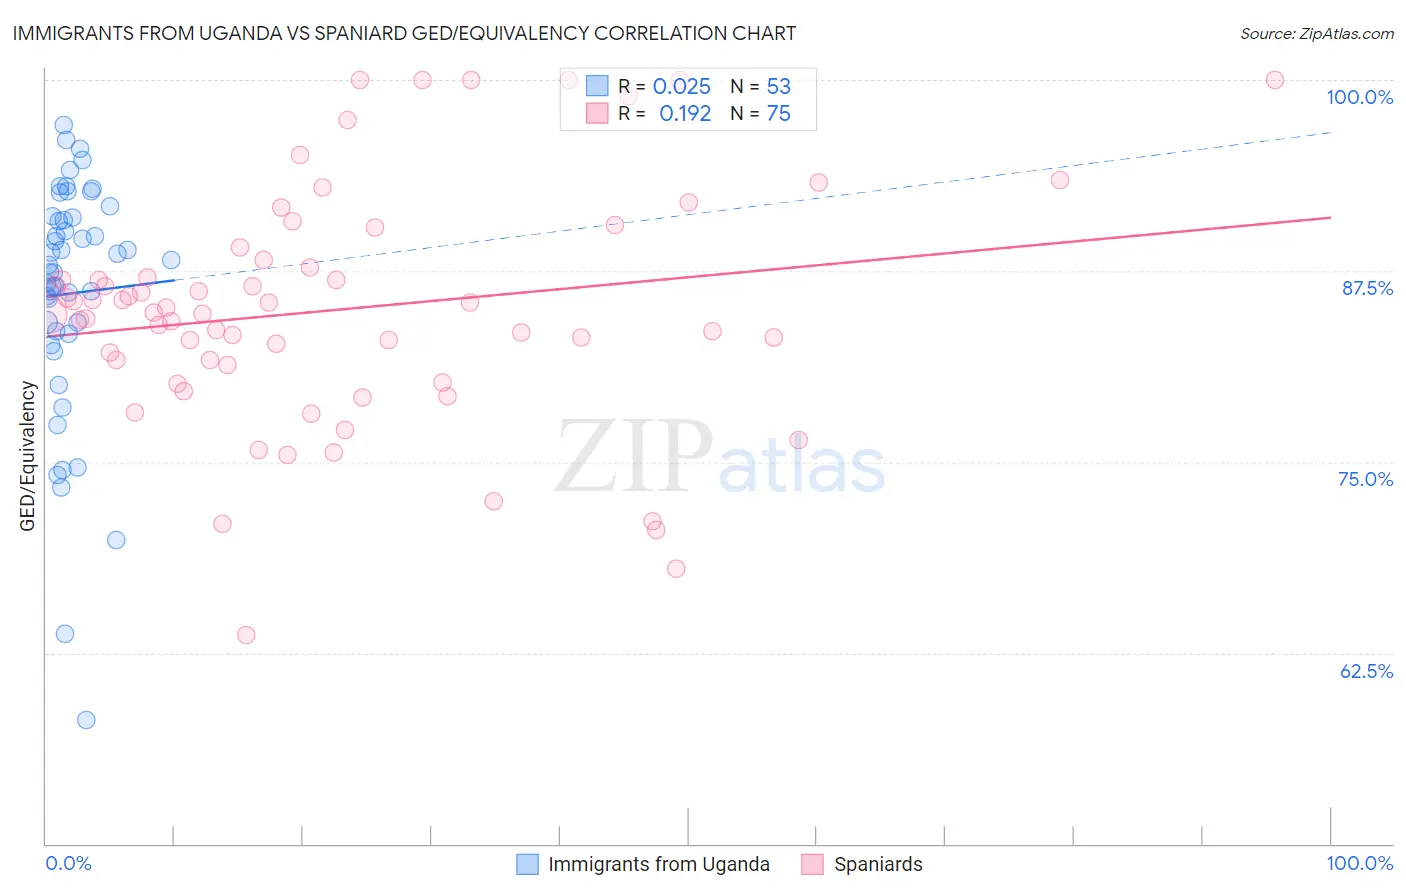
Immigrants from Uganda vs Spaniard GED/Equivalency Correlation Chart
The statistical analysis conducted on geographies consisting of 125,982,219 people shows no correlation between the proportion of Immigrants from Uganda and percentage of population with at least ged/equivalency education in the United States with a correlation coefficient (R) of 0.025 and weighted average of 85.7%. Similarly, the statistical analysis conducted on geographies consisting of 443,545,703 people shows a poor positive correlation between the proportion of Spaniards and percentage of population with at least ged/equivalency education in the United States with a correlation coefficient (R) of 0.192 and weighted average of 85.4%, a difference of 0.29%.
GED/Equivalency Correlation Summary
| Measurement | Immigrants from Uganda | Spaniard |
| Minimum | 58.1% | 63.6% |
| Maximum | 97.1% | 100.0% |
| Range | 39.0% | 36.4% |
| Mean | 86.0% | 85.0% |
| Median | 87.9% | 84.7% |
| Interquartile 25% (IQ1) | 83.5% | 81.4% |
| Interquartile 75% (IQ3) | 91.1% | 88.2% |
| Interquartile Range (IQR) | 7.6% | 6.8% |
| Standard Deviation (Sample) | 8.0% | 7.8% |
| Standard Deviation (Population) | 7.9% | 7.7% |
Demographics Similar to Immigrants from Uganda and Spaniards by GED/Equivalency
In terms of ged/equivalency, the demographic groups most similar to Immigrants from Uganda are Immigrants from Eastern Africa (85.7%, a difference of 0.050%), Korean (85.6%, a difference of 0.080%), Ottawa (85.8%, a difference of 0.10%), Immigrants from Bolivia (85.8%, a difference of 0.10%), and Aleut (85.6%, a difference of 0.10%). Similarly, the demographic groups most similar to Spaniards are Spanish (85.4%, a difference of 0.020%), Immigrants from Oceania (85.5%, a difference of 0.040%), Immigrants from Sudan (85.5%, a difference of 0.050%), Immigrants from Afghanistan (85.4%, a difference of 0.050%), and Sudanese (85.5%, a difference of 0.070%).
| Demographics | Rating | Rank | GED/Equivalency |
| Immigrants | Chile | 57.3 /100 | #171 | Average 85.9% |
| Bermudans | 55.1 /100 | #172 | Average 85.8% |
| Immigrants | Venezuela | 50.7 /100 | #173 | Average 85.8% |
| Ottawa | 50.0 /100 | #174 | Average 85.8% |
| Immigrants | Bolivia | 49.8 /100 | #175 | Average 85.8% |
| Immigrants | Eastern Africa | 47.7 /100 | #176 | Average 85.7% |
| Immigrants | Uganda | 45.2 /100 | #177 | Average 85.7% |
| Koreans | 41.2 /100 | #178 | Average 85.6% |
| Aleuts | 40.5 /100 | #179 | Average 85.6% |
| Immigrants | Southern Europe | 38.4 /100 | #180 | Fair 85.5% |
| Moroccans | 37.7 /100 | #181 | Fair 85.5% |
| Sudanese | 35.2 /100 | #182 | Fair 85.5% |
| Immigrants | Sudan | 34.2 /100 | #183 | Fair 85.5% |
| Immigrants | Oceania | 33.6 /100 | #184 | Fair 85.5% |
| Spanish | 32.8 /100 | #185 | Fair 85.4% |
| Spaniards | 31.9 /100 | #186 | Fair 85.4% |
| Immigrants | Afghanistan | 29.8 /100 | #187 | Fair 85.4% |
| Immigrants | Sierra Leone | 29.0 /100 | #188 | Fair 85.4% |
| Guamanians/Chamorros | 28.4 /100 | #189 | Fair 85.3% |
| Alaskan Athabascans | 27.5 /100 | #190 | Fair 85.3% |
| South American Indians | 22.8 /100 | #191 | Fair 85.2% |