Arapaho vs Spaniard GED/Equivalency
COMPARE
Arapaho
Spaniard
GED/Equivalency
GED/Equivalency Comparison
Arapaho
Spaniards
82.8%
GED/EQUIVALENCY
0.1/ 100
METRIC RATING
277th/ 347
METRIC RANK
85.4%
GED/EQUIVALENCY
31.9/ 100
METRIC RATING
186th/ 347
METRIC RANK
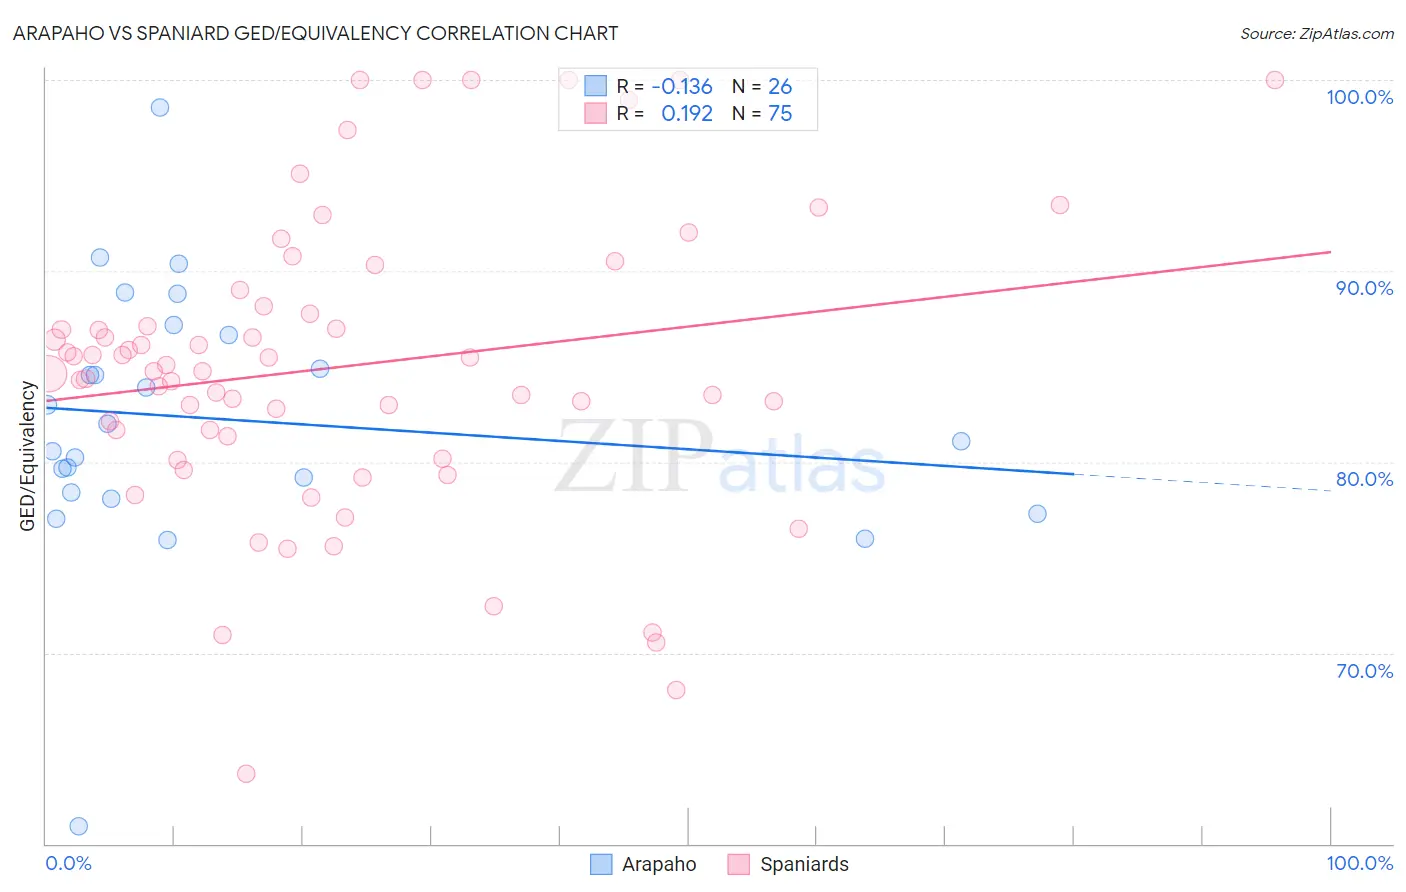
Arapaho vs Spaniard GED/Equivalency Correlation Chart
The statistical analysis conducted on geographies consisting of 29,780,040 people shows a poor negative correlation between the proportion of Arapaho and percentage of population with at least ged/equivalency education in the United States with a correlation coefficient (R) of -0.136 and weighted average of 82.8%. Similarly, the statistical analysis conducted on geographies consisting of 443,545,703 people shows a poor positive correlation between the proportion of Spaniards and percentage of population with at least ged/equivalency education in the United States with a correlation coefficient (R) of 0.192 and weighted average of 85.4%, a difference of 3.2%.
GED/Equivalency Correlation Summary
| Measurement | Arapaho | Spaniard |
| Minimum | 60.9% | 63.6% |
| Maximum | 98.5% | 100.0% |
| Range | 37.6% | 36.4% |
| Mean | 82.2% | 85.0% |
| Median | 81.5% | 84.7% |
| Interquartile 25% (IQ1) | 78.4% | 81.4% |
| Interquartile 75% (IQ3) | 86.6% | 88.2% |
| Interquartile Range (IQR) | 8.2% | 6.8% |
| Standard Deviation (Sample) | 6.9% | 7.8% |
| Standard Deviation (Population) | 6.8% | 7.7% |
Similar Demographics by GED/Equivalency
Demographics Similar to Arapaho by GED/Equivalency
In terms of ged/equivalency, the demographic groups most similar to Arapaho are Black/African American (82.8%, a difference of 0.020%), Immigrants from Laos (82.7%, a difference of 0.030%), Seminole (82.8%, a difference of 0.040%), Immigrants from Fiji (82.7%, a difference of 0.040%), and Cheyenne (82.7%, a difference of 0.050%).
| Demographics | Rating | Rank | GED/Equivalency |
| Immigrants | Jamaica | 0.2 /100 | #270 | Tragic 82.9% |
| U.S. Virgin Islanders | 0.2 /100 | #271 | Tragic 82.9% |
| Barbadians | 0.1 /100 | #272 | Tragic 82.9% |
| Pennsylvania Germans | 0.1 /100 | #273 | Tragic 82.9% |
| Immigrants | Trinidad and Tobago | 0.1 /100 | #274 | Tragic 82.8% |
| Seminole | 0.1 /100 | #275 | Tragic 82.8% |
| Blacks/African Americans | 0.1 /100 | #276 | Tragic 82.8% |
| Arapaho | 0.1 /100 | #277 | Tragic 82.8% |
| Immigrants | Laos | 0.1 /100 | #278 | Tragic 82.7% |
| Immigrants | Fiji | 0.1 /100 | #279 | Tragic 82.7% |
| Cheyenne | 0.1 /100 | #280 | Tragic 82.7% |
| Sioux | 0.1 /100 | #281 | Tragic 82.6% |
| Immigrants | Immigrants | 0.1 /100 | #282 | Tragic 82.6% |
| Indonesians | 0.1 /100 | #283 | Tragic 82.5% |
| Immigrants | Barbados | 0.1 /100 | #284 | Tragic 82.4% |
Demographics Similar to Spaniards by GED/Equivalency
In terms of ged/equivalency, the demographic groups most similar to Spaniards are Spanish (85.4%, a difference of 0.020%), Immigrants from Oceania (85.5%, a difference of 0.040%), Immigrants from Sudan (85.5%, a difference of 0.050%), Immigrants from Afghanistan (85.4%, a difference of 0.050%), and Sudanese (85.5%, a difference of 0.070%).
| Demographics | Rating | Rank | GED/Equivalency |
| Aleuts | 40.5 /100 | #179 | Average 85.6% |
| Immigrants | Southern Europe | 38.4 /100 | #180 | Fair 85.5% |
| Moroccans | 37.7 /100 | #181 | Fair 85.5% |
| Sudanese | 35.2 /100 | #182 | Fair 85.5% |
| Immigrants | Sudan | 34.2 /100 | #183 | Fair 85.5% |
| Immigrants | Oceania | 33.6 /100 | #184 | Fair 85.5% |
| Spanish | 32.8 /100 | #185 | Fair 85.4% |
| Spaniards | 31.9 /100 | #186 | Fair 85.4% |
| Immigrants | Afghanistan | 29.8 /100 | #187 | Fair 85.4% |
| Immigrants | Sierra Leone | 29.0 /100 | #188 | Fair 85.4% |
| Guamanians/Chamorros | 28.4 /100 | #189 | Fair 85.3% |
| Alaskan Athabascans | 27.5 /100 | #190 | Fair 85.3% |
| South American Indians | 22.8 /100 | #191 | Fair 85.2% |
| Immigrants | Nonimmigrants | 22.7 /100 | #192 | Fair 85.2% |
| Delaware | 22.2 /100 | #193 | Fair 85.2% |