Immigrants from St. Vincent and the Grenadines vs Immigrants from Ethiopia GED/Equivalency
COMPARE
Immigrants from St. Vincent and the Grenadines
Immigrants from Ethiopia
GED/Equivalency
GED/Equivalency Comparison
Immigrants from St. Vincent and the Grenadines
Immigrants from Ethiopia
82.0%
GED/EQUIVALENCY
0.0/ 100
METRIC RATING
294th/ 347
METRIC RANK
86.0%
GED/EQUIVALENCY
61.2/ 100
METRIC RATING
169th/ 347
METRIC RANK
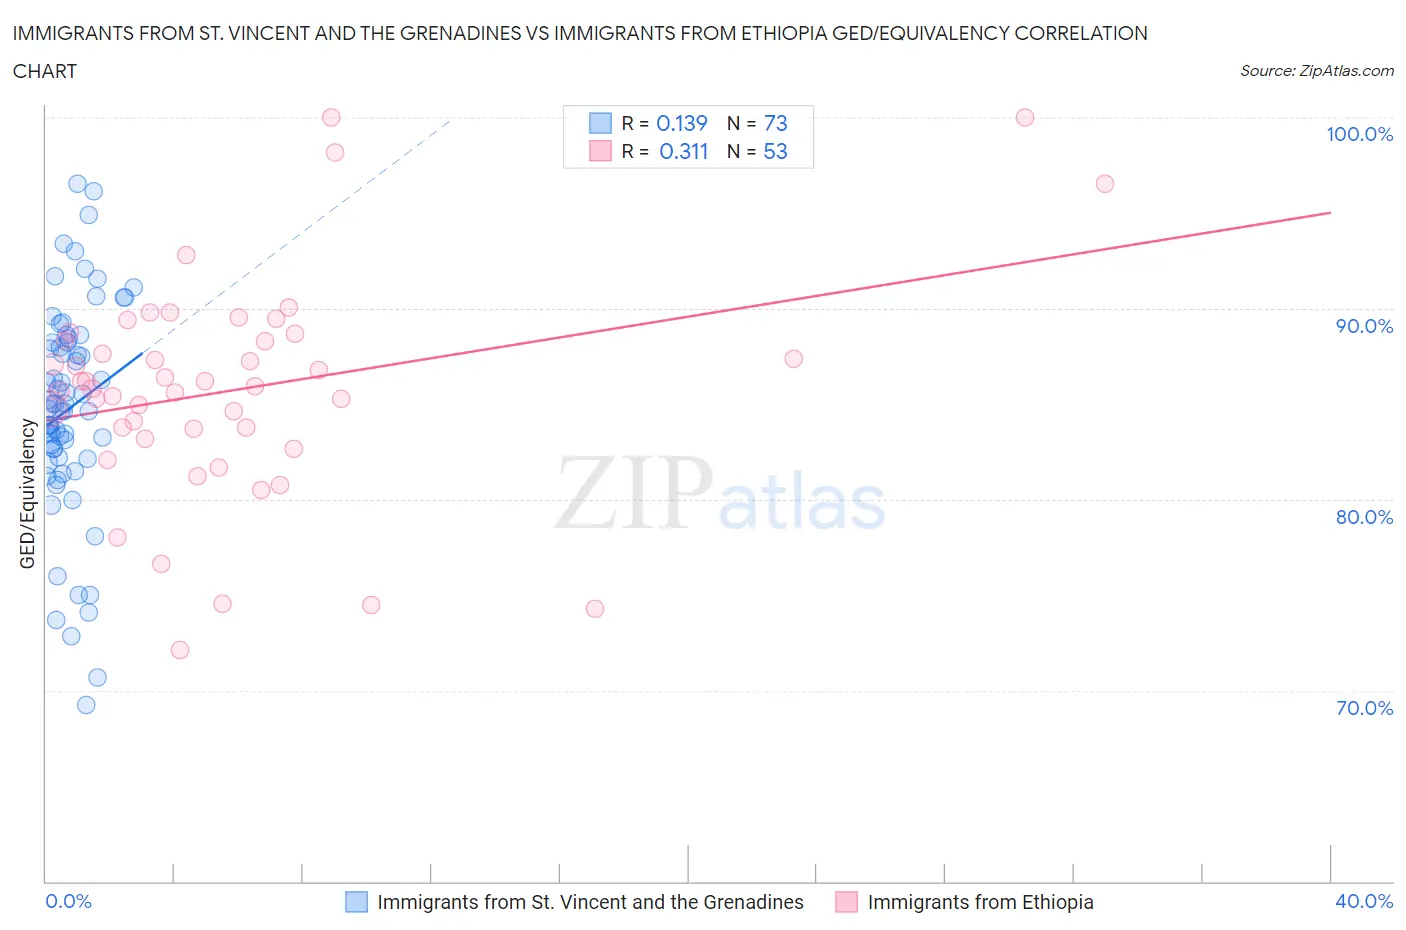
Immigrants from St. Vincent and the Grenadines vs Immigrants from Ethiopia GED/Equivalency Correlation Chart
The statistical analysis conducted on geographies consisting of 56,191,418 people shows a poor positive correlation between the proportion of Immigrants from St. Vincent and the Grenadines and percentage of population with at least ged/equivalency education in the United States with a correlation coefficient (R) of 0.139 and weighted average of 82.0%. Similarly, the statistical analysis conducted on geographies consisting of 211,528,629 people shows a mild positive correlation between the proportion of Immigrants from Ethiopia and percentage of population with at least ged/equivalency education in the United States with a correlation coefficient (R) of 0.311 and weighted average of 86.0%, a difference of 4.8%.
GED/Equivalency Correlation Summary
| Measurement | Immigrants from St. Vincent and the Grenadines | Immigrants from Ethiopia |
| Minimum | 69.2% | 72.1% |
| Maximum | 96.6% | 100.0% |
| Range | 27.3% | 27.9% |
| Mean | 84.8% | 85.8% |
| Median | 85.0% | 85.9% |
| Interquartile 25% (IQ1) | 82.1% | 83.4% |
| Interquartile 75% (IQ3) | 88.3% | 88.5% |
| Interquartile Range (IQR) | 6.2% | 5.0% |
| Standard Deviation (Sample) | 5.6% | 5.7% |
| Standard Deviation (Population) | 5.6% | 5.7% |
Similar Demographics by GED/Equivalency
Demographics Similar to Immigrants from St. Vincent and the Grenadines by GED/Equivalency
In terms of ged/equivalency, the demographic groups most similar to Immigrants from St. Vincent and the Grenadines are Paiute (82.0%, a difference of 0.030%), British West Indian (82.0%, a difference of 0.030%), Nepalese (81.9%, a difference of 0.060%), Cuban (82.0%, a difference of 0.070%), and Haitian (82.1%, a difference of 0.090%).
| Demographics | Rating | Rank | GED/Equivalency |
| Japanese | 0.0 /100 | #287 | Tragic 82.4% |
| Pueblo | 0.0 /100 | #288 | Tragic 82.3% |
| Immigrants | Cambodia | 0.0 /100 | #289 | Tragic 82.2% |
| Haitians | 0.0 /100 | #290 | Tragic 82.1% |
| Cubans | 0.0 /100 | #291 | Tragic 82.0% |
| Paiute | 0.0 /100 | #292 | Tragic 82.0% |
| British West Indians | 0.0 /100 | #293 | Tragic 82.0% |
| Immigrants | St. Vincent and the Grenadines | 0.0 /100 | #294 | Tragic 82.0% |
| Nepalese | 0.0 /100 | #295 | Tragic 81.9% |
| Vietnamese | 0.0 /100 | #296 | Tragic 81.9% |
| Immigrants | Bangladesh | 0.0 /100 | #297 | Tragic 81.9% |
| Ute | 0.0 /100 | #298 | Tragic 81.8% |
| Ecuadorians | 0.0 /100 | #299 | Tragic 81.7% |
| Fijians | 0.0 /100 | #300 | Tragic 81.6% |
| Dutch West Indians | 0.0 /100 | #301 | Tragic 81.6% |
Demographics Similar to Immigrants from Ethiopia by GED/Equivalency
In terms of ged/equivalency, the demographic groups most similar to Immigrants from Ethiopia are Sierra Leonean (86.0%, a difference of 0.010%), Afghan (85.9%, a difference of 0.030%), Ethiopian (86.0%, a difference of 0.050%), Alsatian (86.0%, a difference of 0.070%), and Immigrants from Albania (86.0%, a difference of 0.070%).
| Demographics | Rating | Rank | GED/Equivalency |
| Immigrants | Iraq | 68.1 /100 | #162 | Good 86.1% |
| Ugandans | 66.3 /100 | #163 | Good 86.1% |
| Venezuelans | 65.5 /100 | #164 | Good 86.0% |
| Alsatians | 64.3 /100 | #165 | Good 86.0% |
| Immigrants | Albania | 64.2 /100 | #166 | Good 86.0% |
| Ethiopians | 63.7 /100 | #167 | Good 86.0% |
| Sierra Leoneans | 61.8 /100 | #168 | Good 86.0% |
| Immigrants | Ethiopia | 61.2 /100 | #169 | Good 86.0% |
| Afghans | 59.7 /100 | #170 | Average 85.9% |
| Immigrants | Chile | 57.3 /100 | #171 | Average 85.9% |
| Bermudans | 55.1 /100 | #172 | Average 85.8% |
| Immigrants | Venezuela | 50.7 /100 | #173 | Average 85.8% |
| Ottawa | 50.0 /100 | #174 | Average 85.8% |
| Immigrants | Bolivia | 49.8 /100 | #175 | Average 85.8% |
| Immigrants | Eastern Africa | 47.7 /100 | #176 | Average 85.7% |