West Indian vs Immigrants from Ethiopia GED/Equivalency
COMPARE
West Indian
Immigrants from Ethiopia
GED/Equivalency
GED/Equivalency Comparison
West Indians
Immigrants from Ethiopia
83.1%
GED/EQUIVALENCY
0.2/ 100
METRIC RATING
265th/ 347
METRIC RANK
86.0%
GED/EQUIVALENCY
61.2/ 100
METRIC RATING
169th/ 347
METRIC RANK
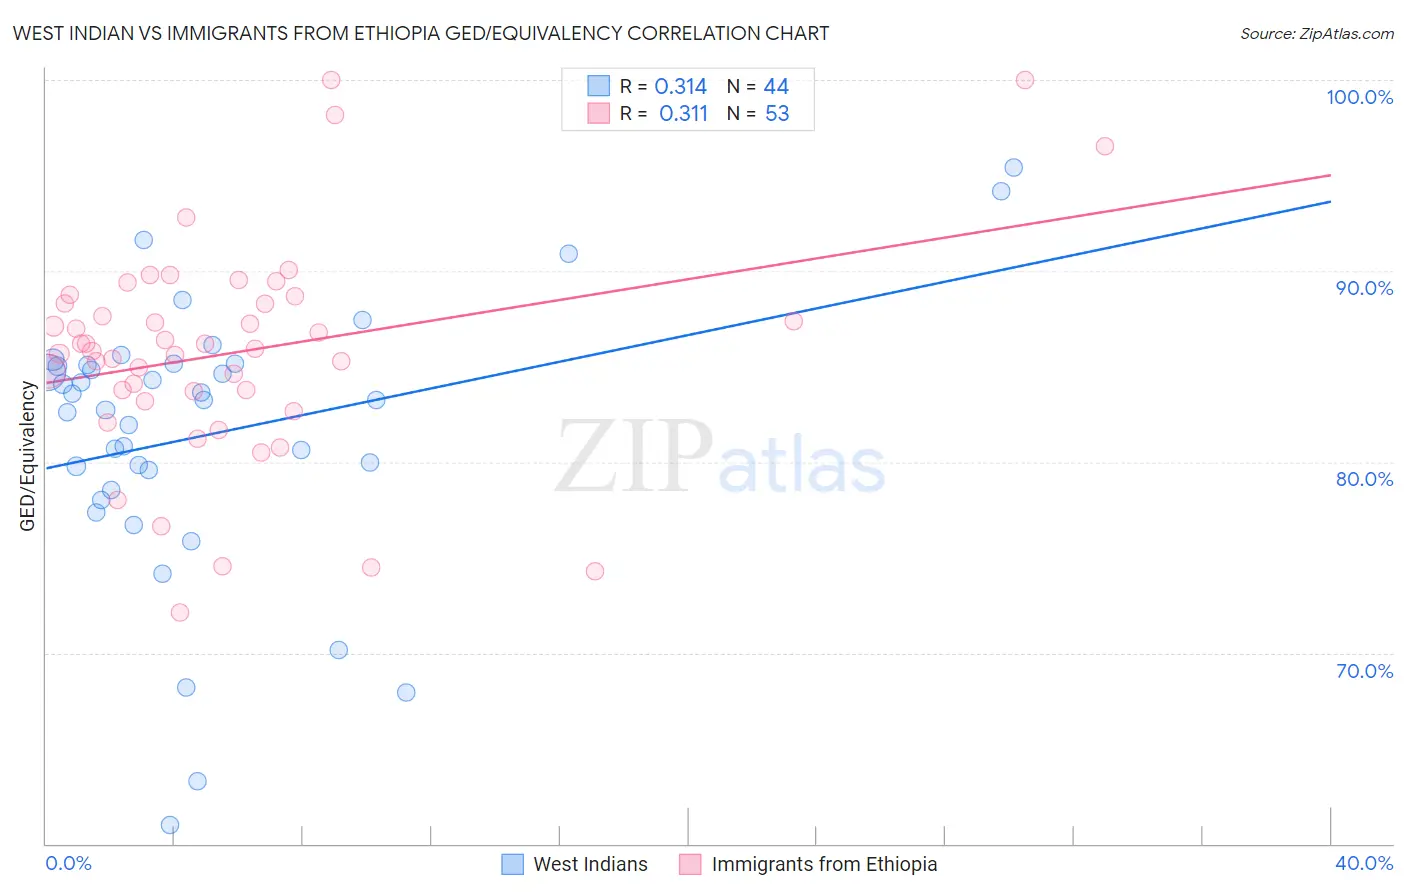
West Indian vs Immigrants from Ethiopia GED/Equivalency Correlation Chart
The statistical analysis conducted on geographies consisting of 254,063,654 people shows a mild positive correlation between the proportion of West Indians and percentage of population with at least ged/equivalency education in the United States with a correlation coefficient (R) of 0.314 and weighted average of 83.1%. Similarly, the statistical analysis conducted on geographies consisting of 211,528,629 people shows a mild positive correlation between the proportion of Immigrants from Ethiopia and percentage of population with at least ged/equivalency education in the United States with a correlation coefficient (R) of 0.311 and weighted average of 86.0%, a difference of 3.5%.
GED/Equivalency Correlation Summary
| Measurement | West Indian | Immigrants from Ethiopia |
| Minimum | 61.0% | 72.1% |
| Maximum | 95.4% | 100.0% |
| Range | 34.5% | 27.9% |
| Mean | 81.5% | 85.8% |
| Median | 83.3% | 85.9% |
| Interquartile 25% (IQ1) | 79.0% | 83.4% |
| Interquartile 75% (IQ3) | 85.1% | 88.5% |
| Interquartile Range (IQR) | 6.1% | 5.0% |
| Standard Deviation (Sample) | 7.2% | 5.7% |
| Standard Deviation (Population) | 7.1% | 5.7% |
Similar Demographics by GED/Equivalency
Demographics Similar to West Indians by GED/Equivalency
In terms of ged/equivalency, the demographic groups most similar to West Indians are Bangladeshi (83.1%, a difference of 0.010%), Kiowa (83.1%, a difference of 0.010%), Immigrants from Congo (83.1%, a difference of 0.020%), Trinidadian and Tobagonian (83.0%, a difference of 0.020%), and Inupiat (83.1%, a difference of 0.030%).
| Demographics | Rating | Rank | GED/Equivalency |
| Malaysians | 0.4 /100 | #258 | Tragic 83.3% |
| Immigrants | Vietnam | 0.3 /100 | #259 | Tragic 83.2% |
| Choctaw | 0.3 /100 | #260 | Tragic 83.1% |
| Inupiat | 0.2 /100 | #261 | Tragic 83.1% |
| Immigrants | Armenia | 0.2 /100 | #262 | Tragic 83.1% |
| Immigrants | Congo | 0.2 /100 | #263 | Tragic 83.1% |
| Bangladeshis | 0.2 /100 | #264 | Tragic 83.1% |
| West Indians | 0.2 /100 | #265 | Tragic 83.1% |
| Kiowa | 0.2 /100 | #266 | Tragic 83.1% |
| Trinidadians and Tobagonians | 0.2 /100 | #267 | Tragic 83.0% |
| Immigrants | Burma/Myanmar | 0.2 /100 | #268 | Tragic 83.0% |
| Hopi | 0.2 /100 | #269 | Tragic 83.0% |
| Immigrants | Jamaica | 0.2 /100 | #270 | Tragic 82.9% |
| U.S. Virgin Islanders | 0.2 /100 | #271 | Tragic 82.9% |
| Barbadians | 0.1 /100 | #272 | Tragic 82.9% |
Demographics Similar to Immigrants from Ethiopia by GED/Equivalency
In terms of ged/equivalency, the demographic groups most similar to Immigrants from Ethiopia are Sierra Leonean (86.0%, a difference of 0.010%), Afghan (85.9%, a difference of 0.030%), Ethiopian (86.0%, a difference of 0.050%), Alsatian (86.0%, a difference of 0.070%), and Immigrants from Albania (86.0%, a difference of 0.070%).
| Demographics | Rating | Rank | GED/Equivalency |
| Immigrants | Iraq | 68.1 /100 | #162 | Good 86.1% |
| Ugandans | 66.3 /100 | #163 | Good 86.1% |
| Venezuelans | 65.5 /100 | #164 | Good 86.0% |
| Alsatians | 64.3 /100 | #165 | Good 86.0% |
| Immigrants | Albania | 64.2 /100 | #166 | Good 86.0% |
| Ethiopians | 63.7 /100 | #167 | Good 86.0% |
| Sierra Leoneans | 61.8 /100 | #168 | Good 86.0% |
| Immigrants | Ethiopia | 61.2 /100 | #169 | Good 86.0% |
| Afghans | 59.7 /100 | #170 | Average 85.9% |
| Immigrants | Chile | 57.3 /100 | #171 | Average 85.9% |
| Bermudans | 55.1 /100 | #172 | Average 85.8% |
| Immigrants | Venezuela | 50.7 /100 | #173 | Average 85.8% |
| Ottawa | 50.0 /100 | #174 | Average 85.8% |
| Immigrants | Bolivia | 49.8 /100 | #175 | Average 85.8% |
| Immigrants | Eastern Africa | 47.7 /100 | #176 | Average 85.7% |