Guyanese vs Immigrants from Ethiopia GED/Equivalency
COMPARE
Guyanese
Immigrants from Ethiopia
GED/Equivalency
GED/Equivalency Comparison
Guyanese
Immigrants from Ethiopia
81.3%
GED/EQUIVALENCY
0.0/ 100
METRIC RATING
306th/ 347
METRIC RANK
86.0%
GED/EQUIVALENCY
61.2/ 100
METRIC RATING
169th/ 347
METRIC RANK
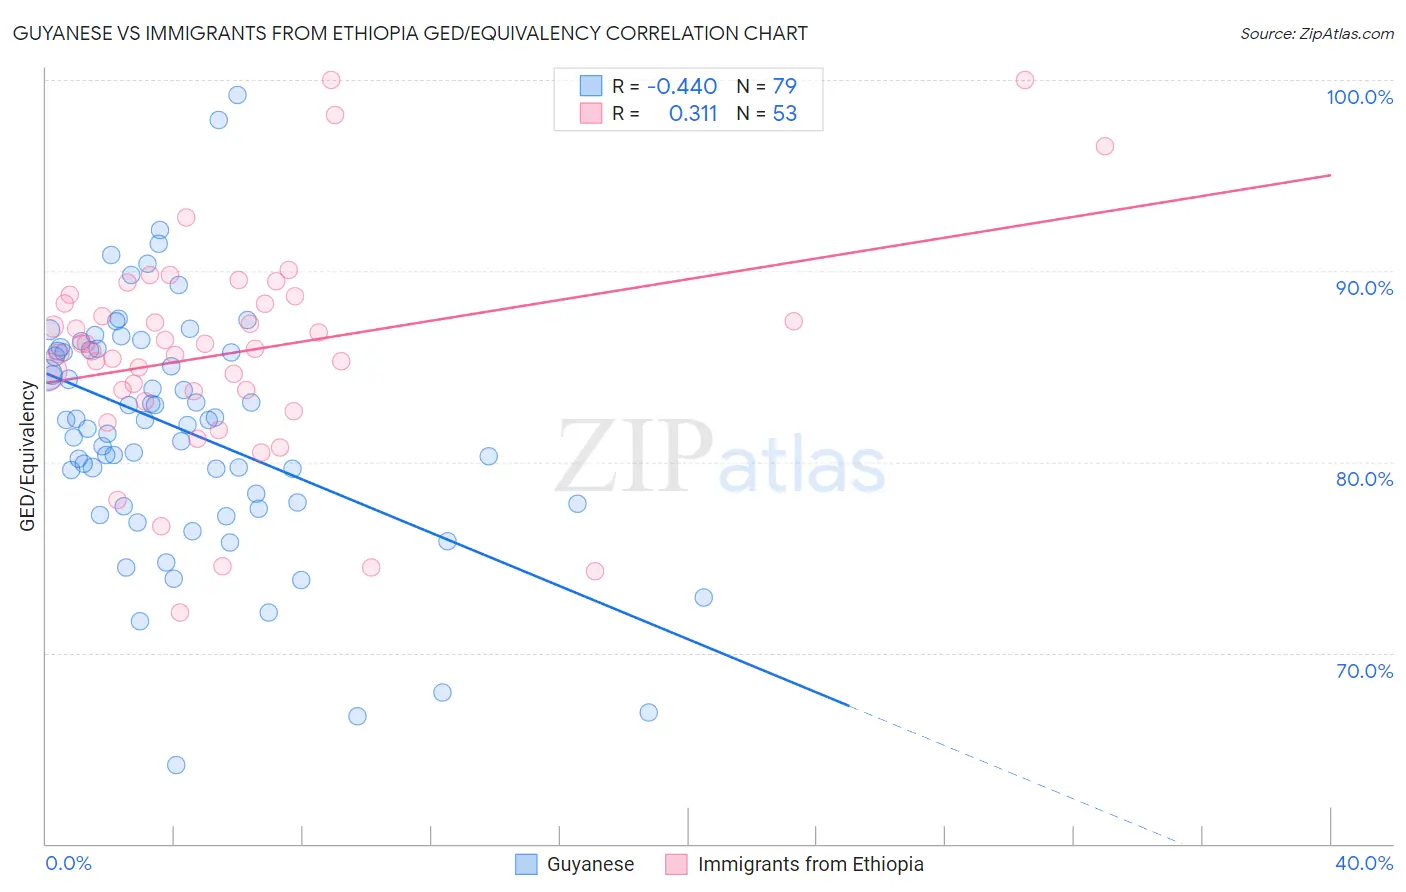
Guyanese vs Immigrants from Ethiopia GED/Equivalency Correlation Chart
The statistical analysis conducted on geographies consisting of 176,940,942 people shows a moderate negative correlation between the proportion of Guyanese and percentage of population with at least ged/equivalency education in the United States with a correlation coefficient (R) of -0.440 and weighted average of 81.3%. Similarly, the statistical analysis conducted on geographies consisting of 211,528,629 people shows a mild positive correlation between the proportion of Immigrants from Ethiopia and percentage of population with at least ged/equivalency education in the United States with a correlation coefficient (R) of 0.311 and weighted average of 86.0%, a difference of 5.7%.
GED/Equivalency Correlation Summary
| Measurement | Guyanese | Immigrants from Ethiopia |
| Minimum | 64.1% | 72.1% |
| Maximum | 99.2% | 100.0% |
| Range | 35.1% | 27.9% |
| Mean | 81.7% | 85.8% |
| Median | 82.2% | 85.9% |
| Interquartile 25% (IQ1) | 77.8% | 83.4% |
| Interquartile 75% (IQ3) | 85.9% | 88.5% |
| Interquartile Range (IQR) | 8.1% | 5.0% |
| Standard Deviation (Sample) | 6.4% | 5.7% |
| Standard Deviation (Population) | 6.3% | 5.7% |
Similar Demographics by GED/Equivalency
Demographics Similar to Guyanese by GED/Equivalency
In terms of ged/equivalency, the demographic groups most similar to Guyanese are Immigrants from Grenada (81.3%, a difference of 0.020%), Immigrants from Dominica (81.1%, a difference of 0.17%), Navajo (81.5%, a difference of 0.23%), Puerto Rican (81.1%, a difference of 0.28%), and Immigrants from Haiti (81.6%, a difference of 0.33%).
| Demographics | Rating | Rank | GED/Equivalency |
| Ecuadorians | 0.0 /100 | #299 | Tragic 81.7% |
| Fijians | 0.0 /100 | #300 | Tragic 81.6% |
| Dutch West Indians | 0.0 /100 | #301 | Tragic 81.6% |
| Immigrants | Haiti | 0.0 /100 | #302 | Tragic 81.6% |
| Immigrants | Portugal | 0.0 /100 | #303 | Tragic 81.6% |
| Navajo | 0.0 /100 | #304 | Tragic 81.5% |
| Immigrants | Grenada | 0.0 /100 | #305 | Tragic 81.3% |
| Guyanese | 0.0 /100 | #306 | Tragic 81.3% |
| Immigrants | Dominica | 0.0 /100 | #307 | Tragic 81.1% |
| Puerto Ricans | 0.0 /100 | #308 | Tragic 81.1% |
| Immigrants | Ecuador | 0.0 /100 | #309 | Tragic 81.0% |
| Immigrants | Guyana | 0.0 /100 | #310 | Tragic 81.0% |
| Natives/Alaskans | 0.0 /100 | #311 | Tragic 80.9% |
| Nicaraguans | 0.0 /100 | #312 | Tragic 80.9% |
| Cape Verdeans | 0.0 /100 | #313 | Tragic 80.9% |
Demographics Similar to Immigrants from Ethiopia by GED/Equivalency
In terms of ged/equivalency, the demographic groups most similar to Immigrants from Ethiopia are Sierra Leonean (86.0%, a difference of 0.010%), Afghan (85.9%, a difference of 0.030%), Ethiopian (86.0%, a difference of 0.050%), Alsatian (86.0%, a difference of 0.070%), and Immigrants from Albania (86.0%, a difference of 0.070%).
| Demographics | Rating | Rank | GED/Equivalency |
| Immigrants | Iraq | 68.1 /100 | #162 | Good 86.1% |
| Ugandans | 66.3 /100 | #163 | Good 86.1% |
| Venezuelans | 65.5 /100 | #164 | Good 86.0% |
| Alsatians | 64.3 /100 | #165 | Good 86.0% |
| Immigrants | Albania | 64.2 /100 | #166 | Good 86.0% |
| Ethiopians | 63.7 /100 | #167 | Good 86.0% |
| Sierra Leoneans | 61.8 /100 | #168 | Good 86.0% |
| Immigrants | Ethiopia | 61.2 /100 | #169 | Good 86.0% |
| Afghans | 59.7 /100 | #170 | Average 85.9% |
| Immigrants | Chile | 57.3 /100 | #171 | Average 85.9% |
| Bermudans | 55.1 /100 | #172 | Average 85.8% |
| Immigrants | Venezuela | 50.7 /100 | #173 | Average 85.8% |
| Ottawa | 50.0 /100 | #174 | Average 85.8% |
| Immigrants | Bolivia | 49.8 /100 | #175 | Average 85.8% |
| Immigrants | Eastern Africa | 47.7 /100 | #176 | Average 85.7% |