Immigrants from Afghanistan vs Pima 4th Grade
COMPARE
Immigrants from Afghanistan
Pima
4th Grade
4th Grade Comparison
Immigrants from Afghanistan
Pima
96.8%
4TH GRADE
0.0/ 100
METRIC RATING
288th/ 347
METRIC RANK
97.7%
4TH GRADE
92.0/ 100
METRIC RATING
128th/ 347
METRIC RANK
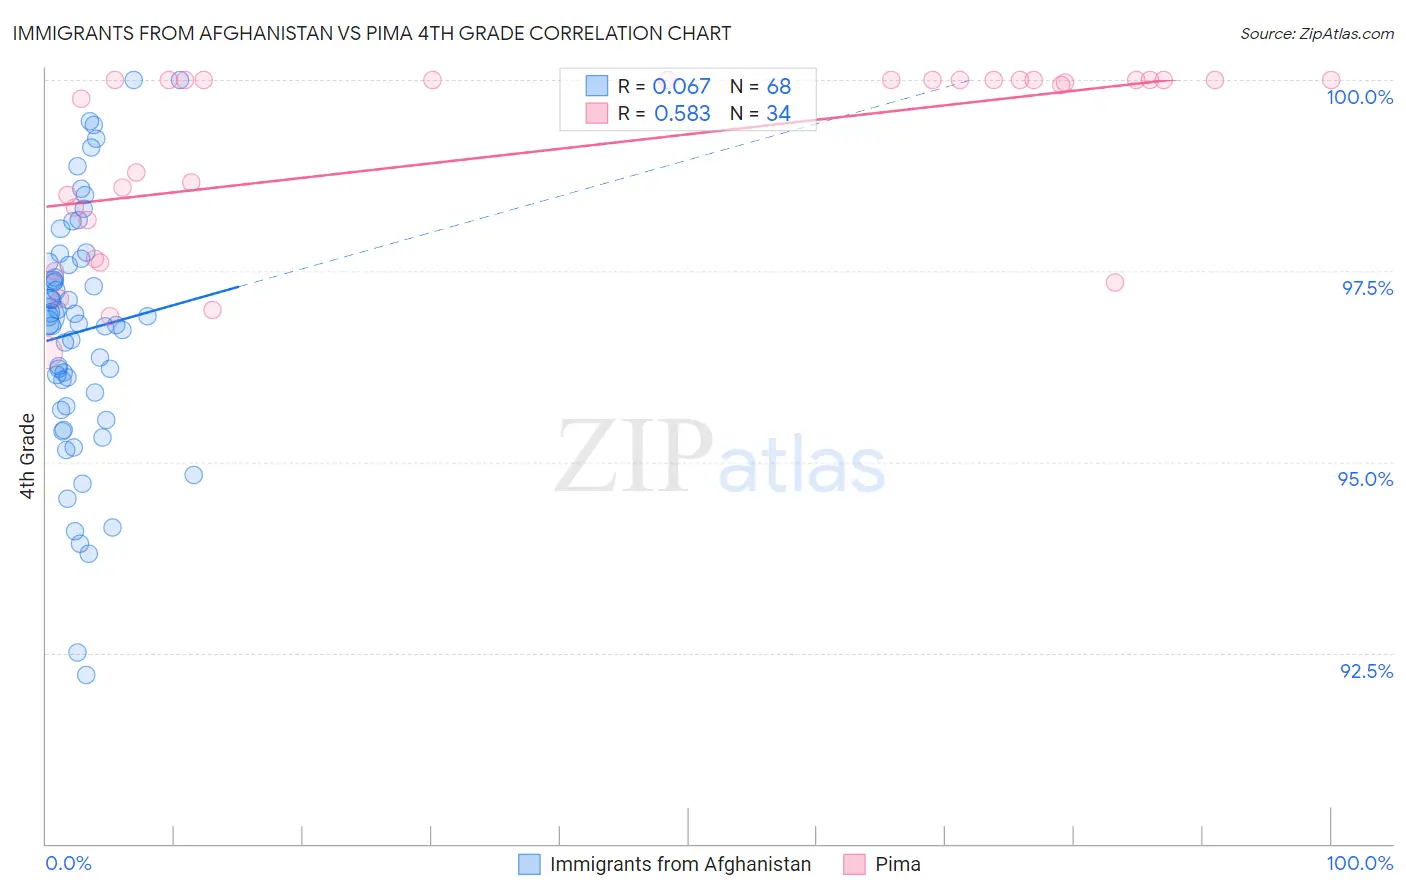
Immigrants from Afghanistan vs Pima 4th Grade Correlation Chart
The statistical analysis conducted on geographies consisting of 147,629,924 people shows a slight positive correlation between the proportion of Immigrants from Afghanistan and percentage of population with at least 4th grade education in the United States with a correlation coefficient (R) of 0.067 and weighted average of 96.8%. Similarly, the statistical analysis conducted on geographies consisting of 61,552,942 people shows a substantial positive correlation between the proportion of Pima and percentage of population with at least 4th grade education in the United States with a correlation coefficient (R) of 0.583 and weighted average of 97.7%, a difference of 1.0%.
4th Grade Correlation Summary
| Measurement | Immigrants from Afghanistan | Pima |
| Minimum | 92.2% | 96.4% |
| Maximum | 100.0% | 100.0% |
| Range | 7.8% | 3.6% |
| Mean | 96.7% | 99.1% |
| Median | 96.9% | 100.0% |
| Interquartile 25% (IQ1) | 95.8% | 98.2% |
| Interquartile 75% (IQ3) | 97.6% | 100.0% |
| Interquartile Range (IQR) | 1.8% | 1.8% |
| Standard Deviation (Sample) | 1.6% | 1.2% |
| Standard Deviation (Population) | 1.6% | 1.2% |
Similar Demographics by 4th Grade
Demographics Similar to Immigrants from Afghanistan by 4th Grade
In terms of 4th grade, the demographic groups most similar to Immigrants from Afghanistan are Houma (96.8%, a difference of 0.0%), Immigrants from West Indies (96.7%, a difference of 0.020%), British West Indian (96.7%, a difference of 0.030%), Immigrants from Barbados (96.8%, a difference of 0.040%), and Immigrants from Thailand (96.8%, a difference of 0.040%).
| Demographics | Rating | Rank | 4th Grade |
| Immigrants | Hong Kong | 0.1 /100 | #281 | Tragic 96.9% |
| Immigrants | Trinidad and Tobago | 0.1 /100 | #282 | Tragic 96.8% |
| Immigrants | Philippines | 0.1 /100 | #283 | Tragic 96.8% |
| Immigrants | St. Vincent and the Grenadines | 0.1 /100 | #284 | Tragic 96.8% |
| Immigrants | Barbados | 0.0 /100 | #285 | Tragic 96.8% |
| Immigrants | Thailand | 0.0 /100 | #286 | Tragic 96.8% |
| Houma | 0.0 /100 | #287 | Tragic 96.8% |
| Immigrants | Afghanistan | 0.0 /100 | #288 | Tragic 96.8% |
| Immigrants | West Indies | 0.0 /100 | #289 | Tragic 96.7% |
| British West Indians | 0.0 /100 | #290 | Tragic 96.7% |
| Immigrants | Grenada | 0.0 /100 | #291 | Tragic 96.7% |
| Malaysians | 0.0 /100 | #292 | Tragic 96.7% |
| Puerto Ricans | 0.0 /100 | #293 | Tragic 96.7% |
| Immigrants | Eritrea | 0.0 /100 | #294 | Tragic 96.7% |
| Immigrants | Portugal | 0.0 /100 | #295 | Tragic 96.6% |
Demographics Similar to Pima by 4th Grade
In terms of 4th grade, the demographic groups most similar to Pima are Colville (97.7%, a difference of 0.0%), Immigrants from Serbia (97.8%, a difference of 0.010%), Immigrants from Europe (97.8%, a difference of 0.010%), Immigrants from Bulgaria (97.7%, a difference of 0.010%), and Spanish (97.8%, a difference of 0.020%).
| Demographics | Rating | Rank | 4th Grade |
| Immigrants | Norway | 94.2 /100 | #121 | Exceptional 97.8% |
| Immigrants | Japan | 94.1 /100 | #122 | Exceptional 97.8% |
| Immigrants | Zimbabwe | 93.9 /100 | #123 | Exceptional 97.8% |
| Spanish | 93.7 /100 | #124 | Exceptional 97.8% |
| Immigrants | Serbia | 92.6 /100 | #125 | Exceptional 97.8% |
| Immigrants | Europe | 92.5 /100 | #126 | Exceptional 97.8% |
| Colville | 92.3 /100 | #127 | Exceptional 97.7% |
| Pima | 92.0 /100 | #128 | Exceptional 97.7% |
| Immigrants | Bulgaria | 91.3 /100 | #129 | Exceptional 97.7% |
| Immigrants | Romania | 90.6 /100 | #130 | Exceptional 97.7% |
| Immigrants | Kuwait | 89.7 /100 | #131 | Excellent 97.7% |
| Immigrants | Hungary | 89.3 /100 | #132 | Excellent 97.7% |
| Hmong | 88.2 /100 | #133 | Excellent 97.7% |
| Palestinians | 88.1 /100 | #134 | Excellent 97.7% |
| Cambodians | 87.8 /100 | #135 | Excellent 97.7% |