Immigrants from Afghanistan vs Native Hawaiian 4th Grade
COMPARE
Immigrants from Afghanistan
Native Hawaiian
4th Grade
4th Grade Comparison
Immigrants from Afghanistan
Native Hawaiians
96.8%
4TH GRADE
0.0/ 100
METRIC RATING
288th/ 347
METRIC RANK
98.1%
4TH GRADE
99.9/ 100
METRIC RATING
44th/ 347
METRIC RANK
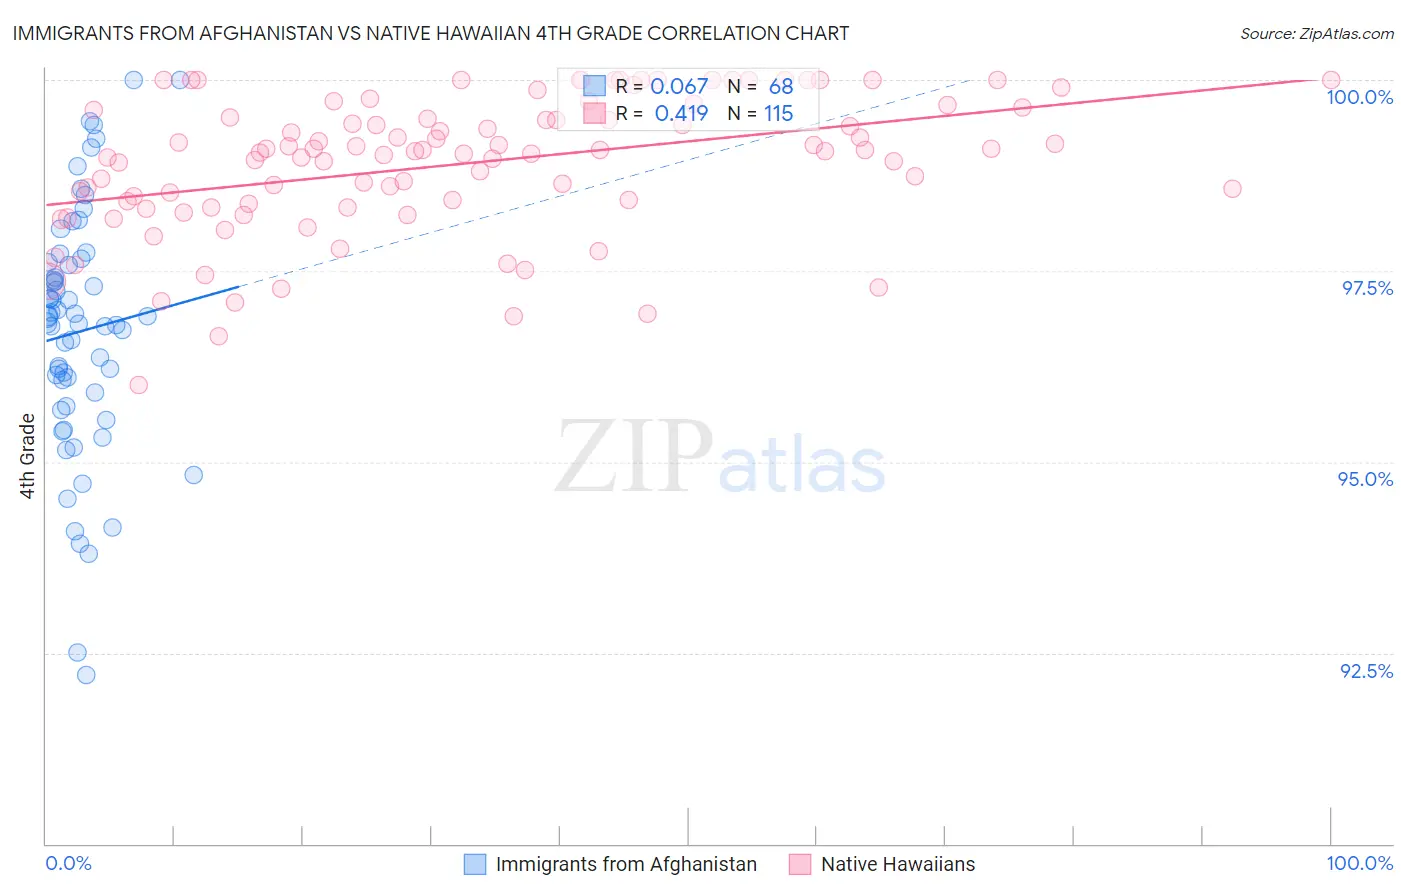
Immigrants from Afghanistan vs Native Hawaiian 4th Grade Correlation Chart
The statistical analysis conducted on geographies consisting of 147,629,924 people shows a slight positive correlation between the proportion of Immigrants from Afghanistan and percentage of population with at least 4th grade education in the United States with a correlation coefficient (R) of 0.067 and weighted average of 96.8%. Similarly, the statistical analysis conducted on geographies consisting of 332,114,626 people shows a moderate positive correlation between the proportion of Native Hawaiians and percentage of population with at least 4th grade education in the United States with a correlation coefficient (R) of 0.419 and weighted average of 98.1%, a difference of 1.4%.
4th Grade Correlation Summary
| Measurement | Immigrants from Afghanistan | Native Hawaiian |
| Minimum | 92.2% | 96.0% |
| Maximum | 100.0% | 100.0% |
| Range | 7.8% | 4.0% |
| Mean | 96.7% | 98.9% |
| Median | 96.9% | 99.1% |
| Interquartile 25% (IQ1) | 95.8% | 98.4% |
| Interquartile 75% (IQ3) | 97.6% | 99.6% |
| Interquartile Range (IQR) | 1.8% | 1.2% |
| Standard Deviation (Sample) | 1.6% | 0.89% |
| Standard Deviation (Population) | 1.6% | 0.88% |
Similar Demographics by 4th Grade
Demographics Similar to Immigrants from Afghanistan by 4th Grade
In terms of 4th grade, the demographic groups most similar to Immigrants from Afghanistan are Houma (96.8%, a difference of 0.0%), Immigrants from West Indies (96.7%, a difference of 0.020%), British West Indian (96.7%, a difference of 0.030%), Immigrants from Barbados (96.8%, a difference of 0.040%), and Immigrants from Thailand (96.8%, a difference of 0.040%).
| Demographics | Rating | Rank | 4th Grade |
| Immigrants | Hong Kong | 0.1 /100 | #281 | Tragic 96.9% |
| Immigrants | Trinidad and Tobago | 0.1 /100 | #282 | Tragic 96.8% |
| Immigrants | Philippines | 0.1 /100 | #283 | Tragic 96.8% |
| Immigrants | St. Vincent and the Grenadines | 0.1 /100 | #284 | Tragic 96.8% |
| Immigrants | Barbados | 0.0 /100 | #285 | Tragic 96.8% |
| Immigrants | Thailand | 0.0 /100 | #286 | Tragic 96.8% |
| Houma | 0.0 /100 | #287 | Tragic 96.8% |
| Immigrants | Afghanistan | 0.0 /100 | #288 | Tragic 96.8% |
| Immigrants | West Indies | 0.0 /100 | #289 | Tragic 96.7% |
| British West Indians | 0.0 /100 | #290 | Tragic 96.7% |
| Immigrants | Grenada | 0.0 /100 | #291 | Tragic 96.7% |
| Malaysians | 0.0 /100 | #292 | Tragic 96.7% |
| Puerto Ricans | 0.0 /100 | #293 | Tragic 96.7% |
| Immigrants | Eritrea | 0.0 /100 | #294 | Tragic 96.7% |
| Immigrants | Portugal | 0.0 /100 | #295 | Tragic 96.6% |
Demographics Similar to Native Hawaiians by 4th Grade
In terms of 4th grade, the demographic groups most similar to Native Hawaiians are Northern European (98.2%, a difference of 0.010%), Czechoslovakian (98.1%, a difference of 0.010%), Hungarian (98.2%, a difference of 0.020%), Ottawa (98.1%, a difference of 0.020%), and Arapaho (98.1%, a difference of 0.020%).
| Demographics | Rating | Rank | 4th Grade |
| Latvians | 99.9 /100 | #37 | Exceptional 98.2% |
| Aleuts | 99.9 /100 | #38 | Exceptional 98.2% |
| Belgians | 99.9 /100 | #39 | Exceptional 98.2% |
| Luxembourgers | 99.9 /100 | #40 | Exceptional 98.2% |
| Eastern Europeans | 99.9 /100 | #41 | Exceptional 98.2% |
| Hungarians | 99.9 /100 | #42 | Exceptional 98.2% |
| Northern Europeans | 99.9 /100 | #43 | Exceptional 98.2% |
| Native Hawaiians | 99.9 /100 | #44 | Exceptional 98.1% |
| Czechoslovakians | 99.9 /100 | #45 | Exceptional 98.1% |
| Ottawa | 99.9 /100 | #46 | Exceptional 98.1% |
| Arapaho | 99.9 /100 | #47 | Exceptional 98.1% |
| Estonians | 99.8 /100 | #48 | Exceptional 98.1% |
| Bulgarians | 99.8 /100 | #49 | Exceptional 98.1% |
| Immigrants | Scotland | 99.8 /100 | #50 | Exceptional 98.1% |
| Celtics | 99.8 /100 | #51 | Exceptional 98.1% |