Immigrants from Sudan vs Pima 4th Grade
COMPARE
Immigrants from Sudan
Pima
4th Grade
4th Grade Comparison
Immigrants from Sudan
Pima
97.2%
4TH GRADE
5.0/ 100
METRIC RATING
223rd/ 347
METRIC RANK
97.7%
4TH GRADE
92.0/ 100
METRIC RATING
128th/ 347
METRIC RANK
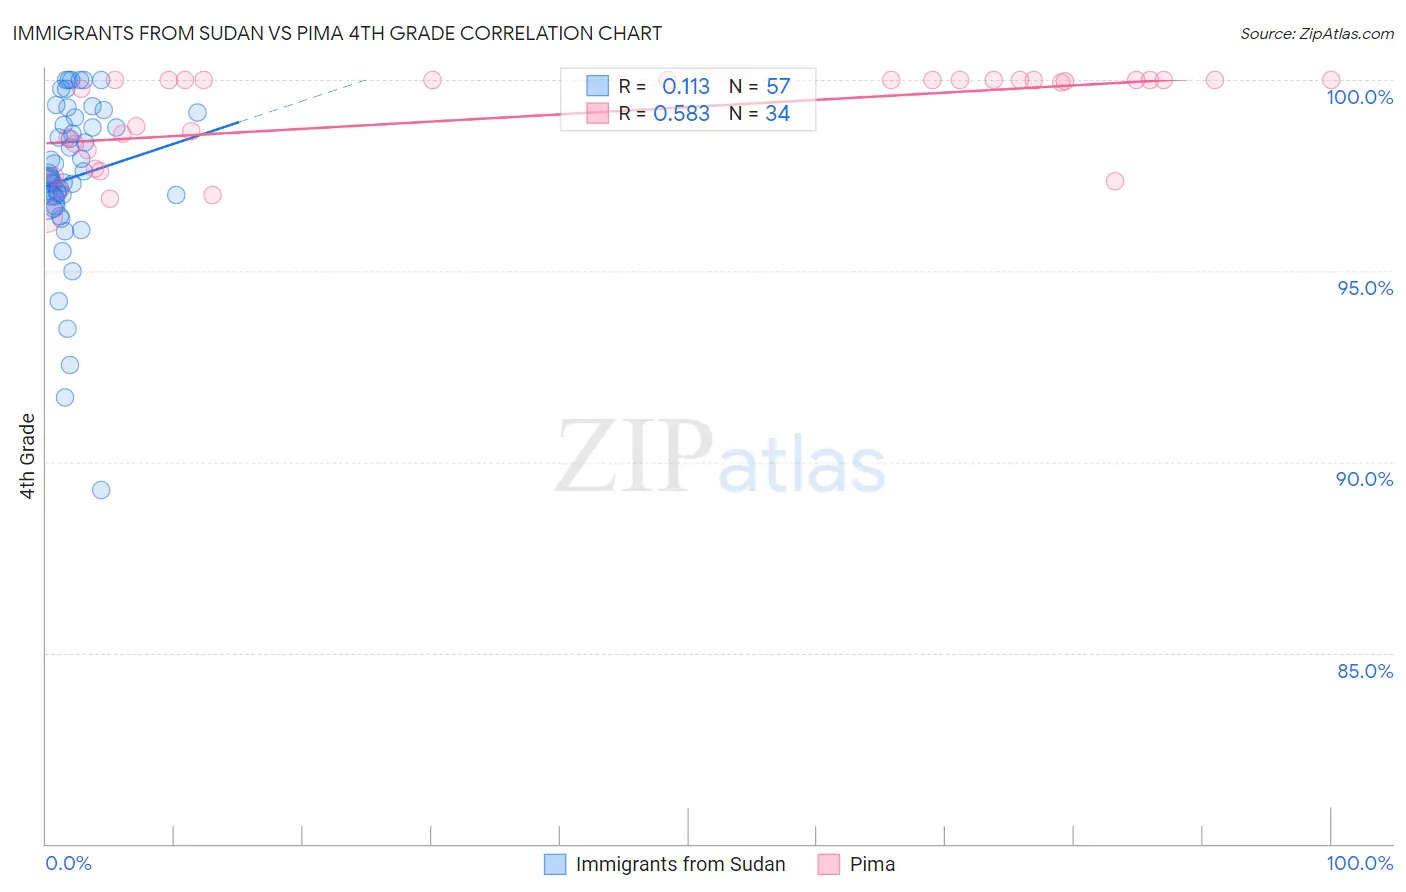
Immigrants from Sudan vs Pima 4th Grade Correlation Chart
The statistical analysis conducted on geographies consisting of 118,959,807 people shows a poor positive correlation between the proportion of Immigrants from Sudan and percentage of population with at least 4th grade education in the United States with a correlation coefficient (R) of 0.113 and weighted average of 97.2%. Similarly, the statistical analysis conducted on geographies consisting of 61,552,942 people shows a substantial positive correlation between the proportion of Pima and percentage of population with at least 4th grade education in the United States with a correlation coefficient (R) of 0.583 and weighted average of 97.7%, a difference of 0.51%.
4th Grade Correlation Summary
| Measurement | Immigrants from Sudan | Pima |
| Minimum | 89.3% | 96.4% |
| Maximum | 100.0% | 100.0% |
| Range | 10.7% | 3.6% |
| Mean | 97.4% | 99.1% |
| Median | 97.4% | 100.0% |
| Interquartile 25% (IQ1) | 96.9% | 98.2% |
| Interquartile 75% (IQ3) | 98.9% | 100.0% |
| Interquartile Range (IQR) | 2.0% | 1.8% |
| Standard Deviation (Sample) | 2.1% | 1.2% |
| Standard Deviation (Population) | 2.1% | 1.2% |
Similar Demographics by 4th Grade
Demographics Similar to Immigrants from Sudan by 4th Grade
In terms of 4th grade, the demographic groups most similar to Immigrants from Sudan are Immigrants from Lebanon (97.3%, a difference of 0.0%), Immigrants from Syria (97.2%, a difference of 0.0%), Tongan (97.3%, a difference of 0.010%), South American Indian (97.3%, a difference of 0.010%), and Immigrants from Panama (97.3%, a difference of 0.010%).
| Demographics | Rating | Rank | 4th Grade |
| Samoans | 6.8 /100 | #216 | Tragic 97.3% |
| Sierra Leoneans | 6.5 /100 | #217 | Tragic 97.3% |
| Iraqis | 6.3 /100 | #218 | Tragic 97.3% |
| Tongans | 5.8 /100 | #219 | Tragic 97.3% |
| South American Indians | 5.5 /100 | #220 | Tragic 97.3% |
| Immigrants | Panama | 5.4 /100 | #221 | Tragic 97.3% |
| Immigrants | Lebanon | 5.1 /100 | #222 | Tragic 97.3% |
| Immigrants | Sudan | 5.0 /100 | #223 | Tragic 97.2% |
| Immigrants | Syria | 5.0 /100 | #224 | Tragic 97.2% |
| Immigrants | Iraq | 4.6 /100 | #225 | Tragic 97.2% |
| Bahamians | 3.8 /100 | #226 | Tragic 97.2% |
| Immigrants | Pakistan | 3.7 /100 | #227 | Tragic 97.2% |
| Sub-Saharan Africans | 3.6 /100 | #228 | Tragic 97.2% |
| Liberians | 3.6 /100 | #229 | Tragic 97.2% |
| Uruguayans | 3.5 /100 | #230 | Tragic 97.2% |
Demographics Similar to Pima by 4th Grade
In terms of 4th grade, the demographic groups most similar to Pima are Colville (97.7%, a difference of 0.0%), Immigrants from Serbia (97.8%, a difference of 0.010%), Immigrants from Europe (97.8%, a difference of 0.010%), Immigrants from Bulgaria (97.7%, a difference of 0.010%), and Spanish (97.8%, a difference of 0.020%).
| Demographics | Rating | Rank | 4th Grade |
| Immigrants | Norway | 94.2 /100 | #121 | Exceptional 97.8% |
| Immigrants | Japan | 94.1 /100 | #122 | Exceptional 97.8% |
| Immigrants | Zimbabwe | 93.9 /100 | #123 | Exceptional 97.8% |
| Spanish | 93.7 /100 | #124 | Exceptional 97.8% |
| Immigrants | Serbia | 92.6 /100 | #125 | Exceptional 97.8% |
| Immigrants | Europe | 92.5 /100 | #126 | Exceptional 97.8% |
| Colville | 92.3 /100 | #127 | Exceptional 97.7% |
| Pima | 92.0 /100 | #128 | Exceptional 97.7% |
| Immigrants | Bulgaria | 91.3 /100 | #129 | Exceptional 97.7% |
| Immigrants | Romania | 90.6 /100 | #130 | Exceptional 97.7% |
| Immigrants | Kuwait | 89.7 /100 | #131 | Excellent 97.7% |
| Immigrants | Hungary | 89.3 /100 | #132 | Excellent 97.7% |
| Hmong | 88.2 /100 | #133 | Excellent 97.7% |
| Palestinians | 88.1 /100 | #134 | Excellent 97.7% |
| Cambodians | 87.8 /100 | #135 | Excellent 97.7% |