Immigrants from Afghanistan vs Pima Female Unemployment
COMPARE
Immigrants from Afghanistan
Pima
Female Unemployment
Female Unemployment Comparison
Immigrants from Afghanistan
Pima
5.4%
FEMALE UNEMPLOYMENT
18.9/ 100
METRIC RATING
205th/ 347
METRIC RANK
9.3%
FEMALE UNEMPLOYMENT
0.0/ 100
METRIC RATING
344th/ 347
METRIC RANK
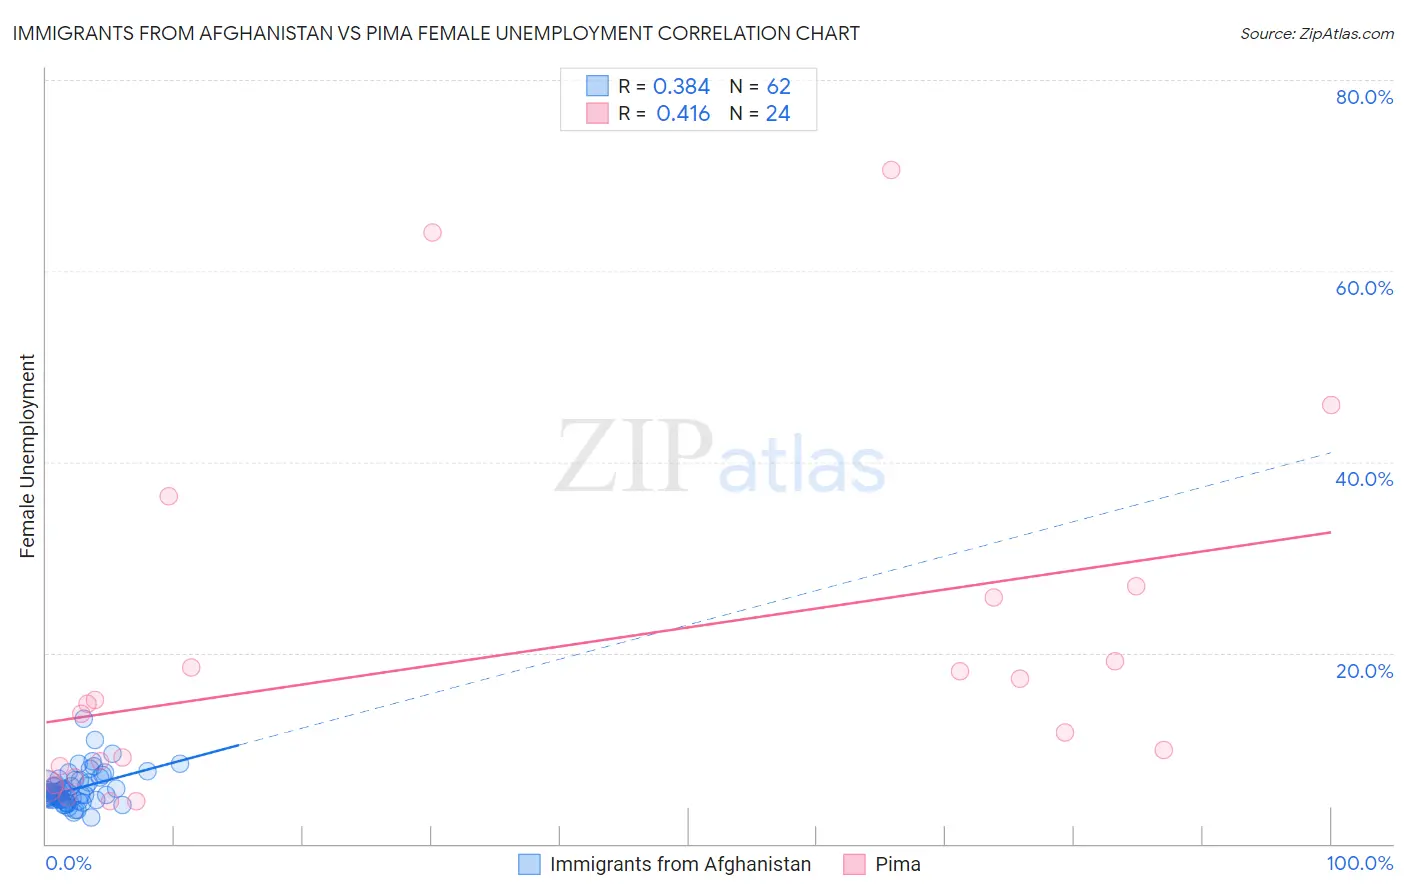
Immigrants from Afghanistan vs Pima Female Unemployment Correlation Chart
The statistical analysis conducted on geographies consisting of 147,540,381 people shows a mild positive correlation between the proportion of Immigrants from Afghanistan and unemploymnet rate among females in the United States with a correlation coefficient (R) of 0.384 and weighted average of 5.4%. Similarly, the statistical analysis conducted on geographies consisting of 61,489,621 people shows a moderate positive correlation between the proportion of Pima and unemploymnet rate among females in the United States with a correlation coefficient (R) of 0.416 and weighted average of 9.3%, a difference of 73.7%.
Female Unemployment Correlation Summary
| Measurement | Immigrants from Afghanistan | Pima |
| Minimum | 2.7% | 4.5% |
| Maximum | 13.1% | 70.6% |
| Range | 10.4% | 66.1% |
| Mean | 5.8% | 19.4% |
| Median | 5.3% | 14.2% |
| Interquartile 25% (IQ1) | 4.6% | 7.5% |
| Interquartile 75% (IQ3) | 6.6% | 22.5% |
| Interquartile Range (IQR) | 2.0% | 14.9% |
| Standard Deviation (Sample) | 1.8% | 18.0% |
| Standard Deviation (Population) | 1.8% | 17.6% |
Similar Demographics by Female Unemployment
Demographics Similar to Immigrants from Afghanistan by Female Unemployment
In terms of female unemployment, the demographic groups most similar to Immigrants from Afghanistan are Immigrants from Brazil (5.4%, a difference of 0.020%), Immigrants from Israel (5.4%, a difference of 0.070%), Immigrants from South Eastern Asia (5.4%, a difference of 0.13%), Immigrants from Middle Africa (5.4%, a difference of 0.18%), and Iroquois (5.4%, a difference of 0.18%).
| Demographics | Rating | Rank | Female Unemployment |
| Tsimshian | 23.1 /100 | #198 | Fair 5.4% |
| Hawaiians | 22.2 /100 | #199 | Fair 5.4% |
| Soviet Union | 21.7 /100 | #200 | Fair 5.4% |
| Immigrants | Middle Africa | 20.8 /100 | #201 | Fair 5.4% |
| Iroquois | 20.8 /100 | #202 | Fair 5.4% |
| Immigrants | South Eastern Asia | 20.3 /100 | #203 | Fair 5.4% |
| Immigrants | Israel | 19.7 /100 | #204 | Poor 5.4% |
| Immigrants | Afghanistan | 18.9 /100 | #205 | Poor 5.4% |
| Immigrants | Brazil | 18.8 /100 | #206 | Poor 5.4% |
| Creek | 15.4 /100 | #207 | Poor 5.4% |
| Immigrants | Costa Rica | 13.7 /100 | #208 | Poor 5.4% |
| Koreans | 13.4 /100 | #209 | Poor 5.4% |
| Choctaw | 12.3 /100 | #210 | Poor 5.4% |
| Ottawa | 11.6 /100 | #211 | Poor 5.4% |
| Uruguayans | 11.4 /100 | #212 | Poor 5.4% |
Demographics Similar to Pima by Female Unemployment
In terms of female unemployment, the demographic groups most similar to Pima are Yuman (9.6%, a difference of 2.8%), Arapaho (8.8%, a difference of 6.2%), Puerto Rican (8.3%, a difference of 11.9%), Inupiat (8.2%, a difference of 14.4%), and Hopi (8.1%, a difference of 15.3%).
| Demographics | Rating | Rank | Female Unemployment |
| Menominee | 0.0 /100 | #333 | Tragic 7.0% |
| Immigrants | Armenia | 0.0 /100 | #334 | Tragic 7.1% |
| Dominicans | 0.0 /100 | #335 | Tragic 7.2% |
| Immigrants | Dominican Republic | 0.0 /100 | #336 | Tragic 7.2% |
| Navajo | 0.0 /100 | #337 | Tragic 7.3% |
| Tohono O'odham | 0.0 /100 | #338 | Tragic 7.7% |
| Immigrants | Yemen | 0.0 /100 | #339 | Tragic 7.8% |
| Hopi | 0.0 /100 | #340 | Tragic 8.1% |
| Inupiat | 0.0 /100 | #341 | Tragic 8.2% |
| Puerto Ricans | 0.0 /100 | #342 | Tragic 8.3% |
| Arapaho | 0.0 /100 | #343 | Tragic 8.8% |
| Pima | 0.0 /100 | #344 | Tragic 9.3% |
| Yuman | 0.0 /100 | #345 | Tragic 9.6% |
| Yup'ik | 0.0 /100 | #346 | Tragic 10.9% |
| Crow | 0.0 /100 | #347 | Tragic 12.1% |