Immigrants from Afghanistan vs Honduran 4th Grade
COMPARE
Immigrants from Afghanistan
Honduran
4th Grade
4th Grade Comparison
Immigrants from Afghanistan
Hondurans
96.8%
4TH GRADE
0.0/ 100
METRIC RATING
288th/ 347
METRIC RANK
96.0%
4TH GRADE
0.0/ 100
METRIC RATING
327th/ 347
METRIC RANK
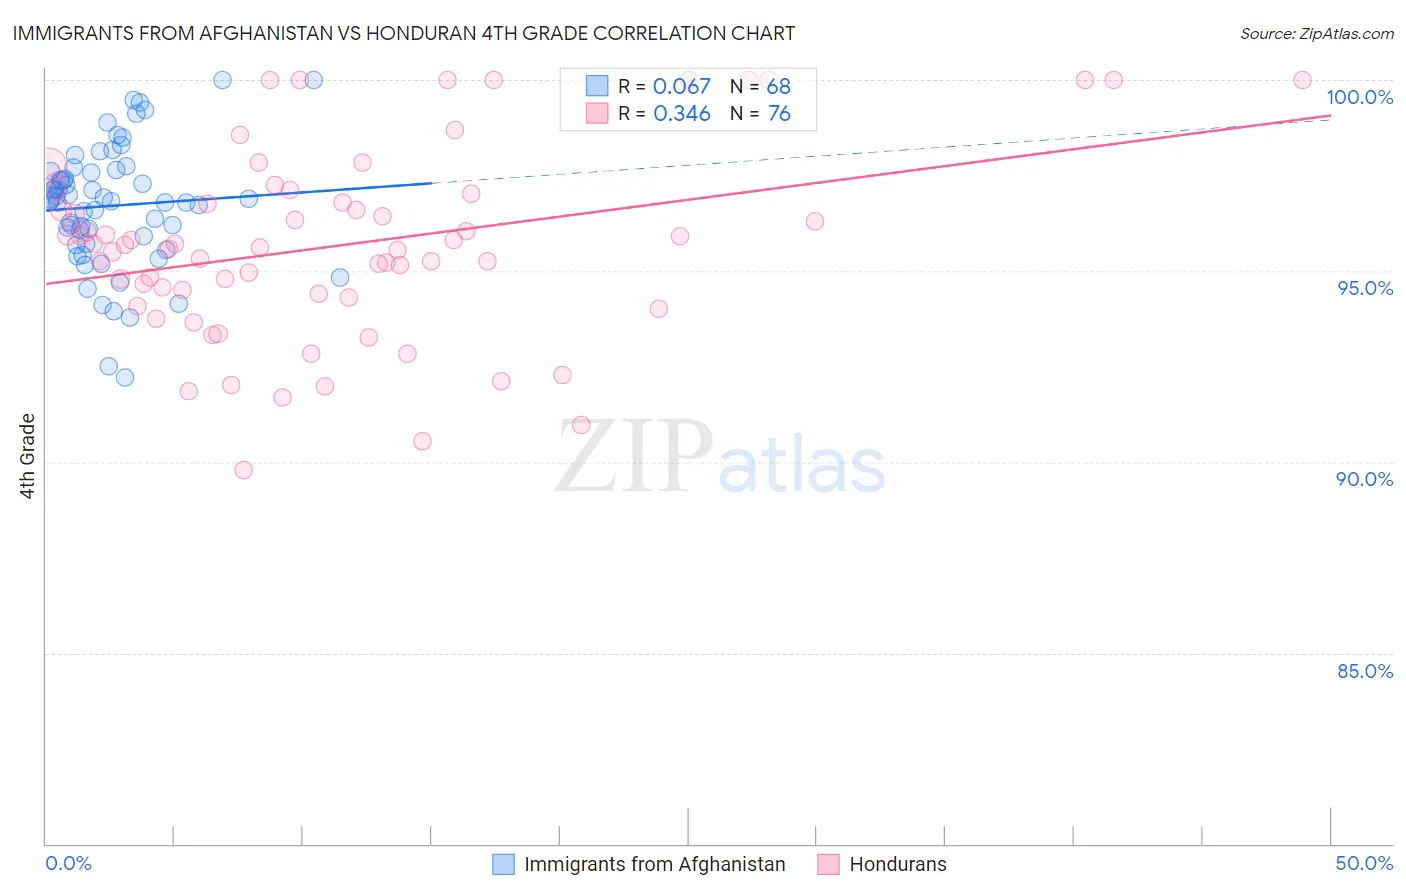
Immigrants from Afghanistan vs Honduran 4th Grade Correlation Chart
The statistical analysis conducted on geographies consisting of 147,629,924 people shows a slight positive correlation between the proportion of Immigrants from Afghanistan and percentage of population with at least 4th grade education in the United States with a correlation coefficient (R) of 0.067 and weighted average of 96.8%. Similarly, the statistical analysis conducted on geographies consisting of 357,784,803 people shows a mild positive correlation between the proportion of Hondurans and percentage of population with at least 4th grade education in the United States with a correlation coefficient (R) of 0.346 and weighted average of 96.0%, a difference of 0.84%.
4th Grade Correlation Summary
| Measurement | Immigrants from Afghanistan | Honduran |
| Minimum | 92.2% | 89.8% |
| Maximum | 100.0% | 100.0% |
| Range | 7.8% | 10.2% |
| Mean | 96.7% | 95.7% |
| Median | 96.9% | 95.7% |
| Interquartile 25% (IQ1) | 95.8% | 94.4% |
| Interquartile 75% (IQ3) | 97.6% | 96.9% |
| Interquartile Range (IQR) | 1.8% | 2.6% |
| Standard Deviation (Sample) | 1.6% | 2.5% |
| Standard Deviation (Population) | 1.6% | 2.4% |
Similar Demographics by 4th Grade
Demographics Similar to Immigrants from Afghanistan by 4th Grade
In terms of 4th grade, the demographic groups most similar to Immigrants from Afghanistan are Houma (96.8%, a difference of 0.0%), Immigrants from West Indies (96.7%, a difference of 0.020%), British West Indian (96.7%, a difference of 0.030%), Immigrants from Barbados (96.8%, a difference of 0.040%), and Immigrants from Thailand (96.8%, a difference of 0.040%).
| Demographics | Rating | Rank | 4th Grade |
| Immigrants | Hong Kong | 0.1 /100 | #281 | Tragic 96.9% |
| Immigrants | Trinidad and Tobago | 0.1 /100 | #282 | Tragic 96.8% |
| Immigrants | Philippines | 0.1 /100 | #283 | Tragic 96.8% |
| Immigrants | St. Vincent and the Grenadines | 0.1 /100 | #284 | Tragic 96.8% |
| Immigrants | Barbados | 0.0 /100 | #285 | Tragic 96.8% |
| Immigrants | Thailand | 0.0 /100 | #286 | Tragic 96.8% |
| Houma | 0.0 /100 | #287 | Tragic 96.8% |
| Immigrants | Afghanistan | 0.0 /100 | #288 | Tragic 96.8% |
| Immigrants | West Indies | 0.0 /100 | #289 | Tragic 96.7% |
| British West Indians | 0.0 /100 | #290 | Tragic 96.7% |
| Immigrants | Grenada | 0.0 /100 | #291 | Tragic 96.7% |
| Malaysians | 0.0 /100 | #292 | Tragic 96.7% |
| Puerto Ricans | 0.0 /100 | #293 | Tragic 96.7% |
| Immigrants | Eritrea | 0.0 /100 | #294 | Tragic 96.7% |
| Immigrants | Portugal | 0.0 /100 | #295 | Tragic 96.6% |
Demographics Similar to Hondurans by 4th Grade
In terms of 4th grade, the demographic groups most similar to Hondurans are Dominican (96.0%, a difference of 0.020%), Hispanic or Latino (96.0%, a difference of 0.020%), Immigrants from Belize (96.0%, a difference of 0.030%), Immigrants from Nicaragua (96.0%, a difference of 0.040%), and Japanese (96.0%, a difference of 0.060%).
| Demographics | Rating | Rank | 4th Grade |
| Bangladeshis | 0.0 /100 | #320 | Tragic 96.1% |
| Japanese | 0.0 /100 | #321 | Tragic 96.0% |
| Immigrants | Vietnam | 0.0 /100 | #322 | Tragic 96.0% |
| Immigrants | Nicaragua | 0.0 /100 | #323 | Tragic 96.0% |
| Immigrants | Belize | 0.0 /100 | #324 | Tragic 96.0% |
| Dominicans | 0.0 /100 | #325 | Tragic 96.0% |
| Hispanics or Latinos | 0.0 /100 | #326 | Tragic 96.0% |
| Hondurans | 0.0 /100 | #327 | Tragic 96.0% |
| Mexican American Indians | 0.0 /100 | #328 | Tragic 95.8% |
| Immigrants | Cambodia | 0.0 /100 | #329 | Tragic 95.8% |
| Immigrants | Fiji | 0.0 /100 | #330 | Tragic 95.8% |
| Immigrants | Armenia | 0.0 /100 | #331 | Tragic 95.8% |
| Immigrants | Honduras | 0.0 /100 | #332 | Tragic 95.8% |
| Immigrants | Dominican Republic | 0.0 /100 | #333 | Tragic 95.7% |
| Immigrants | Cabo Verde | 0.0 /100 | #334 | Tragic 95.7% |