Immigrants from Afghanistan vs Pima Births to Unmarried Women

COMPARE

Immigrants from Afghanistan
Race
Ancestry
AfghanAfricanAlaska NativeAlaskan AthabascanAlbanianAleutAlsatianAmericanApacheArabArapahoArgentineanArmenianAssyrian/Chaldean/SyriacAustralianAustrianBahamianBangladeshiBarbadianBasqueBelgianBelizeanBermudanBhutaneseBlackfeetBolivianBrazilianBritishBritish West IndianBulgarianBurmeseCajunCambodianCanadianCape VerdeanCarpatho RusynCelticCentral AmericanCentral American IndianCherokeeCheyenneChickasawChileanChineseChippewaChoctawColombianColvilleComancheCosta RicanCreeCreekCroatianCrowCubanCypriotCzechCzechoslovakianDanishDelawareDominicanDutchDutch West IndianEastern EuropeanEcuadorianEgyptianEnglishEstonianEthiopianEuropeanFijianFilipinoFinnishFrenchFrench American IndianFrench CanadianGermanGerman RussianGhanaianGreekGuamanian/ChamorroGuatemalanGuyaneseHaitianHmongHonduranHopiHoumaHungarianIcelanderIndian (Asian)IndonesianInupiatIranianIraqiIrishIroquoisIsraeliItalianJamaicanJapaneseJordanianKenyanKiowaKoreanLaotianLatvianLebaneseLiberianLithuanianLumbeeLuxembourgerMacedonianMalaysianMalteseMarshalleseMenomineeMexicanMexican American IndianMongolianMoroccanNative HawaiianNavajoNepaleseNew ZealanderNicaraguanNigerianNorthern EuropeanNorwegianOkinawanOsageOttawaPaiutePakistaniPalestinianPanamanianParaguayanPennsylvania GermanPeruvianPolishPortuguesePotawatomiPuebloPuerto RicanPuget Sound SalishRomanianRussianSalvadoranSamoanScandinavianScotch-IrishScottishSeminoleSenegaleseSerbianShoshoneSierra LeoneanSiouxSlavicSlovakSloveneSomaliSouth AfricanSouth AmericanSouth American IndianSoviet UnionSpaniardSpanishSpanish AmericanSpanish American IndianSri LankanSubsaharan AfricanSudaneseSwedishSwissSyrianTaiwaneseThaiTlingit-HaidaTohono O'OdhamTonganTrinidadian and TobagonianTsimshianTurkishU.S. Virgin IslanderUgandanUkrainianUruguayanUteVenezuelanVietnameseWelshWest IndianYakamaYaquiYugoslavianYumanYup'ikZimbabwean
Immigration
NonimmigrantsImmigrantsAfghanistanAfricaAlbaniaArgentinaArmeniaAsiaAustraliaAustriaBahamasBangladeshBarbadosBelarusBelgiumBelizeBoliviaBosnia and HerzegovinaBrazilBulgariaBurma/MyanmarCabo VerdeCambodiaCameroonCanadaCaribbeanCentral AmericaChileChinaColombiaCongoCosta RicaCroatiaCubaCzechoslovakiaDenmarkDominicaDominican RepublicEastern AfricaEastern AsiaEastern EuropeEcuadorEgyptEl SalvadorEnglandEritreaEthiopiaEuropeFijiFranceGermanyGhanaGreeceGrenadaGuatemalaGuyanaHaitiHondurasHong KongHungaryIndiaIndonesiaIranIraqIrelandIsraelItalyJamaicaJapanJordanKazakhstanKenyaKoreaKuwaitLaosLatin AmericaLatviaLebanonLiberiaLithuaniaMalaysiaMexicoMicronesiaMiddle AfricaMoldovaMoroccoNepalNetherlandsNicaraguaNigeriaNorth AmericaNorth MacedoniaNorthern AfricaNorthern EuropeNorwayOceaniaPakistanPanamaPeruPhilippinesPolandPortugalRomaniaRussiaSaudi ArabiaScotlandSenegalSerbiaSierra LeoneSingaporeSomaliaSouth AfricaSouth AmericaSouth Central AsiaSouth Eastern AsiaSouthern EuropeSpainSri LankaSt. Vincent and the GrenadinesSudanSwedenSwitzerlandSyriaTaiwanThailandTrinidad and TobagoTurkeyUgandaUkraineUruguayUzbekistanVenezuelaVietnamWest IndiesWestern AfricaWestern AsiaWestern EuropeYemenZaireZimbabweAzores
Pima
Race
Ancestry
AfghanAfricanAlaska NativeAlaskan AthabascanAlbanianAleutAlsatianAmericanApacheArabArapahoArgentineanArmenianAssyrian/Chaldean/SyriacAustralianAustrianBahamianBangladeshiBarbadianBasqueBelgianBelizeanBermudanBhutaneseBlackfeetBolivianBrazilianBritishBritish West IndianBulgarianBurmeseCajunCambodianCanadianCape VerdeanCarpatho RusynCelticCentral AmericanCentral American IndianCherokeeCheyenneChickasawChileanChineseChippewaChoctawColombianColvilleComancheCosta RicanCreeCreekCroatianCrowCubanCypriotCzechCzechoslovakianDanishDelawareDominicanDutchDutch West IndianEastern EuropeanEcuadorianEgyptianEnglishEstonianEthiopianEuropeanFijianFilipinoFinnishFrenchFrench American IndianFrench CanadianGermanGerman RussianGhanaianGreekGuamanian/ChamorroGuatemalanGuyaneseHaitianHmongHonduranHopiHoumaHungarianIcelanderIndian (Asian)IndonesianInupiatIranianIraqiIrishIroquoisIsraeliItalianJamaicanJapaneseJordanianKenyanKiowaKoreanLaotianLatvianLebaneseLiberianLithuanianLumbeeLuxembourgerMacedonianMalaysianMalteseMarshalleseMenomineeMexicanMexican American IndianMongolianMoroccanNative HawaiianNavajoNepaleseNew ZealanderNicaraguanNigerianNorthern EuropeanNorwegianOkinawanOsageOttawaPaiutePakistaniPalestinianPanamanianParaguayanPennsylvania GermanPeruvianPimaPolishPortuguesePotawatomiPuebloPuerto RicanPuget Sound SalishRomanianRussianSalvadoranSamoanScandinavianScotch-IrishScottishSeminoleSenegaleseSerbianShoshoneSierra LeoneanSiouxSlavicSlovakSloveneSomaliSouth AfricanSouth AmericanSouth American IndianSoviet UnionSpaniardSpanishSpanish AmericanSpanish American IndianSri LankanSubsaharan AfricanSudaneseSwedishSwissSyrianTaiwaneseThaiTlingit-HaidaTohono O'OdhamTonganTrinidadian and TobagonianTsimshianTurkishU.S. Virgin IslanderUgandanUkrainianUruguayanUteVenezuelanVietnameseWelshWest IndianYakamaYaquiYugoslavianYumanYup'ikZimbabwean
Immigration
NonimmigrantsImmigrantsAfricaAlbaniaArgentinaArmeniaAsiaAustraliaAustriaBahamasBangladeshBarbadosBelarusBelgiumBelizeBoliviaBosnia and HerzegovinaBrazilBulgariaBurma/MyanmarCabo VerdeCambodiaCameroonCanadaCaribbeanCentral AmericaChileChinaColombiaCongoCosta RicaCroatiaCubaCzechoslovakiaDenmarkDominicaDominican RepublicEastern AfricaEastern AsiaEastern EuropeEcuadorEgyptEl SalvadorEnglandEritreaEthiopiaEuropeFijiFranceGermanyGhanaGreeceGrenadaGuatemalaGuyanaHaitiHondurasHong KongHungaryIndiaIndonesiaIranIraqIrelandIsraelItalyJamaicaJapanJordanKazakhstanKenyaKoreaKuwaitLaosLatin AmericaLatviaLebanonLiberiaLithuaniaMalaysiaMexicoMicronesiaMiddle AfricaMoldovaMoroccoNepalNetherlandsNicaraguaNigeriaNorth AmericaNorth MacedoniaNorthern AfricaNorthern EuropeNorwayOceaniaPakistanPanamaPeruPhilippinesPolandPortugalRomaniaRussiaSaudi ArabiaScotlandSenegalSerbiaSierra LeoneSingaporeSomaliaSouth AfricaSouth AmericaSouth Central AsiaSouth Eastern AsiaSouthern EuropeSpainSri LankaSt. Vincent and the GrenadinesSudanSwedenSwitzerlandSyriaTaiwanThailandTrinidad and TobagoTurkeyUgandaUkraineUruguayUzbekistanVenezuelaVietnamWest IndiesWestern AfricaWestern AsiaWestern EuropeYemenZaireZimbabweAzores
Births to Unmarried Women
Income
Poverty
Unemployment
Labor Participation
Family Structure
Vehicle Availability
Education Level
Disability

Births to Unmarried Women Comparison

Immigrants from Afghanistan

Pima

Exceptional
Tragic
28.7%
BIRTHS TO UNMARRIED WOMEN
98.1/ 100
METRIC RATING
80th/ 347
METRIC RANK
51.5%
BIRTHS TO UNMARRIED WOMEN
0.0/ 100
METRIC RATING
343rd/ 347
METRIC RANK

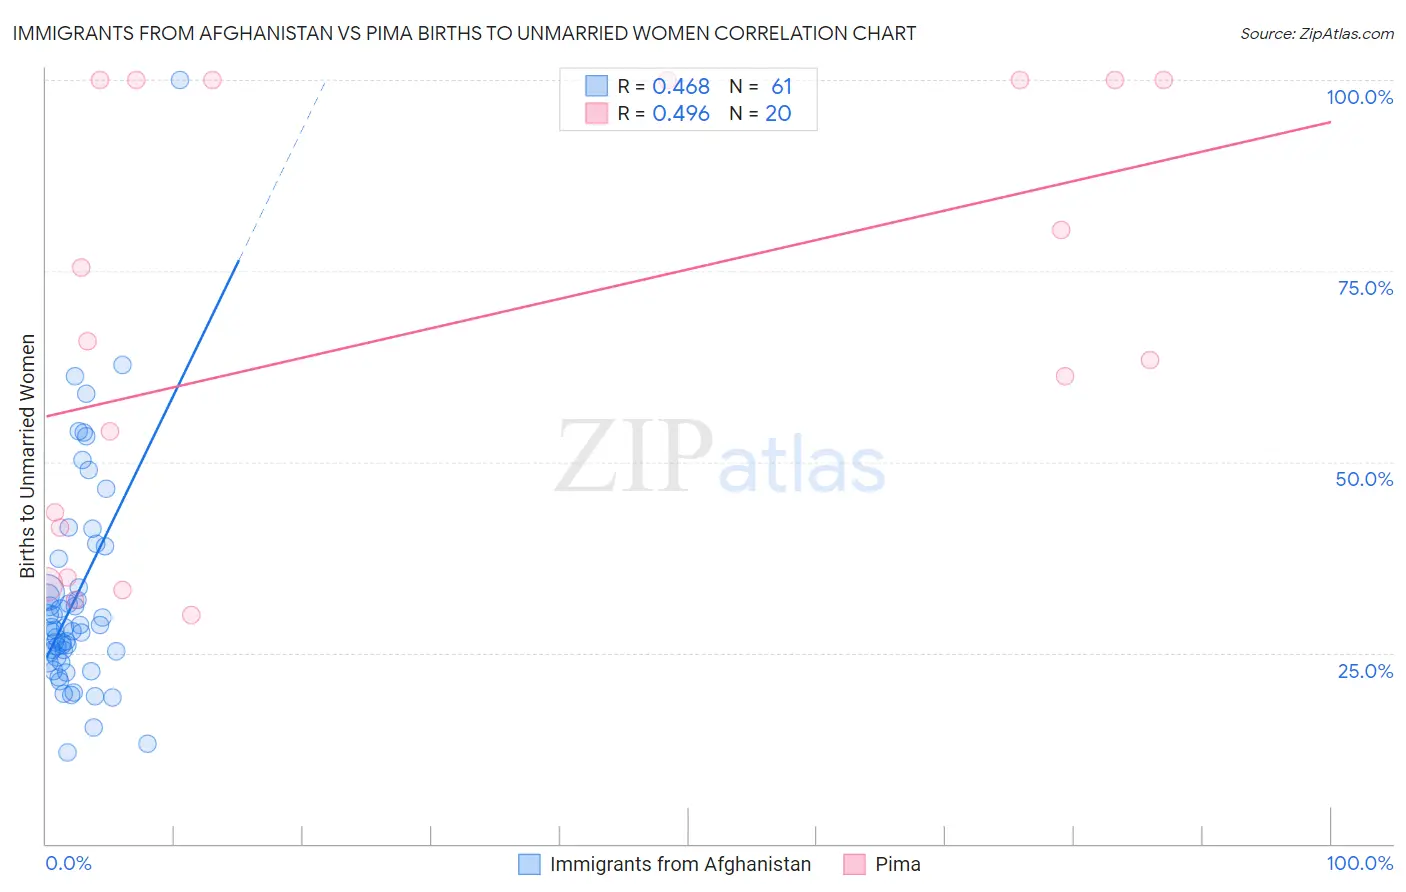
Immigrants from Afghanistan vs Pima Births to Unmarried Women Correlation Chart

The statistical analysis conducted on geographies consisting of 143,617,588 people shows a moderate positive correlation between the proportion of Immigrants from Afghanistan and percentage of births to unmarried women in the United States with a correlation coefficient (R) of 0.468 and weighted average of 28.7%. Similarly, the statistical analysis conducted on geographies consisting of 60,986,588 people shows a moderate positive correlation between the proportion of Pima and percentage of births to unmarried women in the United States with a correlation coefficient (R) of 0.496 and weighted average of 51.5%, a difference of 79.3%.
Immigrants from Afghanistan vs Pima Births to Unmarried Women

Births to Unmarried Women Correlation Summary

MeasurementImmigrants from AfghanistanPima
Minimum11.9%30.0%
Maximum100.0%100.0%
Range88.1%70.0%
Mean32.2%67.5%
Median28.0%64.6%
Interquartile 25% (IQ1)24.1%38.1%
Interquartile 75% (IQ3)35.4%100.0%
Interquartile Range (IQR)11.4%61.9%
Standard Deviation (Sample)14.6%28.2%
Standard Deviation (Population)14.5%27.5%

Similar Demographics by Births to Unmarried Women

Demographics Similar to Immigrants from Afghanistan by Births to Unmarried Women

In terms of births to unmarried women, the demographic groups most similar to Immigrants from Afghanistan are Danish (28.7%, a difference of 0.020%), Immigrants from Austria (28.7%, a difference of 0.040%), Zimbabwean (28.7%, a difference of 0.050%), Romanian (28.7%, a difference of 0.15%), and Immigrants from Northern Europe (28.6%, a difference of 0.21%).
DemographicsRating | RankBirths to Unmarried Women
Albanians
98.5
/100
|
#73
Exceptional
28.5%
Immigrants | Bolivia
98.5
/100
|
#74
Exceptional
28.6%
Immigrants | Switzerland
98.4
/100
|
#75
Exceptional
28.6%
Israelis
98.4
/100
|
#76
Exceptional
28.6%
Immigrants | Northern Europe
98.3
/100
|
#77
Exceptional
28.6%
Zimbabweans
98.2
/100
|
#78
Exceptional
28.7%
Danes
98.2
/100
|
#79
Exceptional
28.7%
Immigrants | Afghanistan
98.1
/100
|
#80
Exceptional
28.7%
Immigrants | Austria
98.1
/100
|
#81
Exceptional
28.7%
Romanians
98.0
/100
|
#82
Exceptional
28.7%
Immigrants | Kuwait
98.0
/100
|
#83
Exceptional
28.8%
Immigrants | Poland
97.6
/100
|
#84
Exceptional
28.9%
Sri Lankans
97.5
/100
|
#85
Exceptional
28.9%
Immigrants | Jordan
97.4
/100
|
#86
Exceptional
29.0%
Taiwanese
97.3
/100
|
#87
Exceptional
29.0%

Demographics Similar to Pima by Births to Unmarried Women

In terms of births to unmarried women, the demographic groups most similar to Pima are Navajo (51.5%, a difference of 0.040%), Menominee (51.1%, a difference of 0.70%), Inupiat (52.1%, a difference of 1.2%), Hopi (50.8%, a difference of 1.3%), and Tohono O'odham (49.8%, a difference of 3.3%).
DemographicsRating | RankBirths to Unmarried Women
Blacks/African Americans
0.0
/100
|
#333
Tragic
44.3%
Yuman
0.0
/100
|
#334
Tragic
44.4%
Colville
0.0
/100
|
#335
Tragic
45.3%
Puerto Ricans
0.0
/100
|
#336
Tragic
45.7%
Houma
0.0
/100
|
#337
Tragic
46.6%
Arapaho
0.0
/100
|
#338
Tragic
47.1%
Lumbee
0.0
/100
|
#339
Tragic
48.2%
Tohono O'odham
0.0
/100
|
#340
Tragic
49.8%
Hopi
0.0
/100
|
#341
Tragic
50.8%
Menominee
0.0
/100
|
#342
Tragic
51.1%
Pima
0.0
/100
|
#343
Tragic
51.5%
Navajo
0.0
/100
|
#344
Tragic
51.5%
Inupiat
0.0
/100
|
#345
Tragic
52.1%
Pueblo
0.0
/100
|
#346
Tragic
53.7%
Yup'ik
0.0
/100
|
#347
Tragic
56.4%