Immigrants from Afghanistan vs Immigrants from Eastern Europe 4th Grade
COMPARE
Immigrants from Afghanistan
Immigrants from Eastern Europe
4th Grade
4th Grade Comparison
Immigrants from Afghanistan
Immigrants from Eastern Europe
96.8%
4TH GRADE
0.0/ 100
METRIC RATING
288th/ 347
METRIC RANK
97.6%
4TH GRADE
71.3/ 100
METRIC RATING
153rd/ 347
METRIC RANK
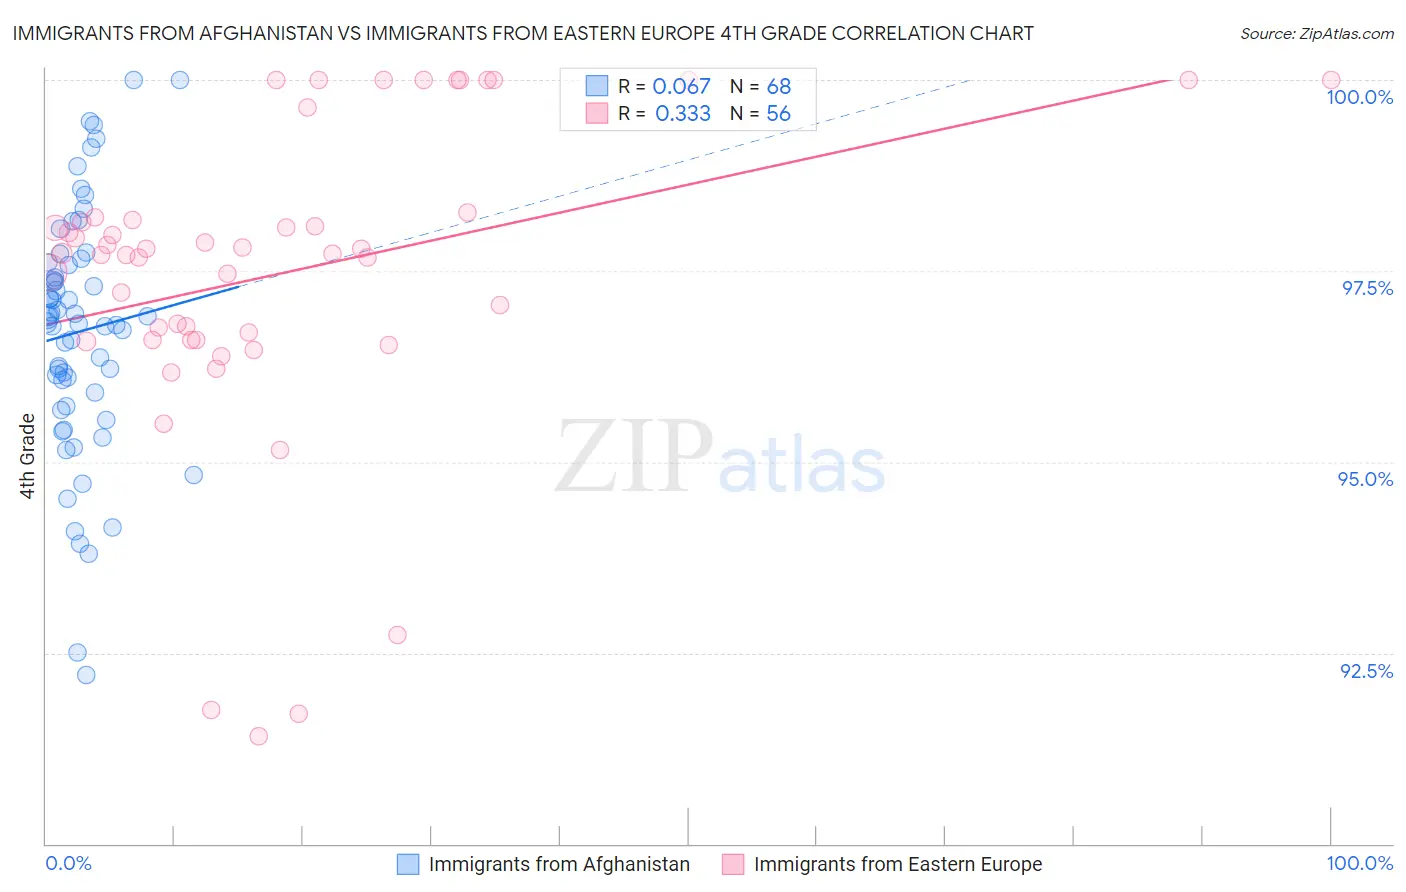
Immigrants from Afghanistan vs Immigrants from Eastern Europe 4th Grade Correlation Chart
The statistical analysis conducted on geographies consisting of 147,629,924 people shows a slight positive correlation between the proportion of Immigrants from Afghanistan and percentage of population with at least 4th grade education in the United States with a correlation coefficient (R) of 0.067 and weighted average of 96.8%. Similarly, the statistical analysis conducted on geographies consisting of 475,879,420 people shows a mild positive correlation between the proportion of Immigrants from Eastern Europe and percentage of population with at least 4th grade education in the United States with a correlation coefficient (R) of 0.333 and weighted average of 97.6%, a difference of 0.86%.
4th Grade Correlation Summary
| Measurement | Immigrants from Afghanistan | Immigrants from Eastern Europe |
| Minimum | 92.2% | 91.4% |
| Maximum | 100.0% | 100.0% |
| Range | 7.8% | 8.6% |
| Mean | 96.7% | 97.5% |
| Median | 96.9% | 97.7% |
| Interquartile 25% (IQ1) | 95.8% | 96.6% |
| Interquartile 75% (IQ3) | 97.6% | 98.2% |
| Interquartile Range (IQR) | 1.8% | 1.6% |
| Standard Deviation (Sample) | 1.6% | 2.0% |
| Standard Deviation (Population) | 1.6% | 2.0% |
Similar Demographics by 4th Grade
Demographics Similar to Immigrants from Afghanistan by 4th Grade
In terms of 4th grade, the demographic groups most similar to Immigrants from Afghanistan are Houma (96.8%, a difference of 0.0%), Immigrants from West Indies (96.7%, a difference of 0.020%), British West Indian (96.7%, a difference of 0.030%), Immigrants from Barbados (96.8%, a difference of 0.040%), and Immigrants from Thailand (96.8%, a difference of 0.040%).
| Demographics | Rating | Rank | 4th Grade |
| Immigrants | Hong Kong | 0.1 /100 | #281 | Tragic 96.9% |
| Immigrants | Trinidad and Tobago | 0.1 /100 | #282 | Tragic 96.8% |
| Immigrants | Philippines | 0.1 /100 | #283 | Tragic 96.8% |
| Immigrants | St. Vincent and the Grenadines | 0.1 /100 | #284 | Tragic 96.8% |
| Immigrants | Barbados | 0.0 /100 | #285 | Tragic 96.8% |
| Immigrants | Thailand | 0.0 /100 | #286 | Tragic 96.8% |
| Houma | 0.0 /100 | #287 | Tragic 96.8% |
| Immigrants | Afghanistan | 0.0 /100 | #288 | Tragic 96.8% |
| Immigrants | West Indies | 0.0 /100 | #289 | Tragic 96.7% |
| British West Indians | 0.0 /100 | #290 | Tragic 96.7% |
| Immigrants | Grenada | 0.0 /100 | #291 | Tragic 96.7% |
| Malaysians | 0.0 /100 | #292 | Tragic 96.7% |
| Puerto Ricans | 0.0 /100 | #293 | Tragic 96.7% |
| Immigrants | Eritrea | 0.0 /100 | #294 | Tragic 96.7% |
| Immigrants | Portugal | 0.0 /100 | #295 | Tragic 96.6% |
Demographics Similar to Immigrants from Eastern Europe by 4th Grade
In terms of 4th grade, the demographic groups most similar to Immigrants from Eastern Europe are Immigrants from South Central Asia (97.6%, a difference of 0.020%), Immigrants from Russia (97.6%, a difference of 0.020%), Albanian (97.6%, a difference of 0.020%), Immigrants from Jordan (97.6%, a difference of 0.020%), and Immigrants from Bosnia and Herzegovina (97.6%, a difference of 0.020%).
| Demographics | Rating | Rank | 4th Grade |
| Jordanians | 81.3 /100 | #146 | Excellent 97.7% |
| Ute | 80.6 /100 | #147 | Excellent 97.7% |
| Hopi | 80.6 /100 | #148 | Excellent 97.7% |
| Soviet Union | 77.8 /100 | #149 | Good 97.6% |
| Immigrants | Israel | 77.7 /100 | #150 | Good 97.6% |
| Alsatians | 77.2 /100 | #151 | Good 97.6% |
| Immigrants | South Central Asia | 76.2 /100 | #152 | Good 97.6% |
| Immigrants | Eastern Europe | 71.3 /100 | #153 | Good 97.6% |
| Immigrants | Russia | 67.0 /100 | #154 | Good 97.6% |
| Albanians | 67.0 /100 | #155 | Good 97.6% |
| Immigrants | Jordan | 66.9 /100 | #156 | Good 97.6% |
| Immigrants | Bosnia and Herzegovina | 66.0 /100 | #157 | Good 97.6% |
| French American Indians | 65.9 /100 | #158 | Good 97.6% |
| Immigrants | Italy | 63.7 /100 | #159 | Good 97.6% |
| Apache | 61.3 /100 | #160 | Good 97.6% |