Hopi vs Pima 4th Grade
COMPARE
Hopi
Pima
4th Grade
4th Grade Comparison
Hopi
Pima
97.7%
4TH GRADE
80.6/ 100
METRIC RATING
148th/ 347
METRIC RANK
97.7%
4TH GRADE
92.0/ 100
METRIC RATING
128th/ 347
METRIC RANK
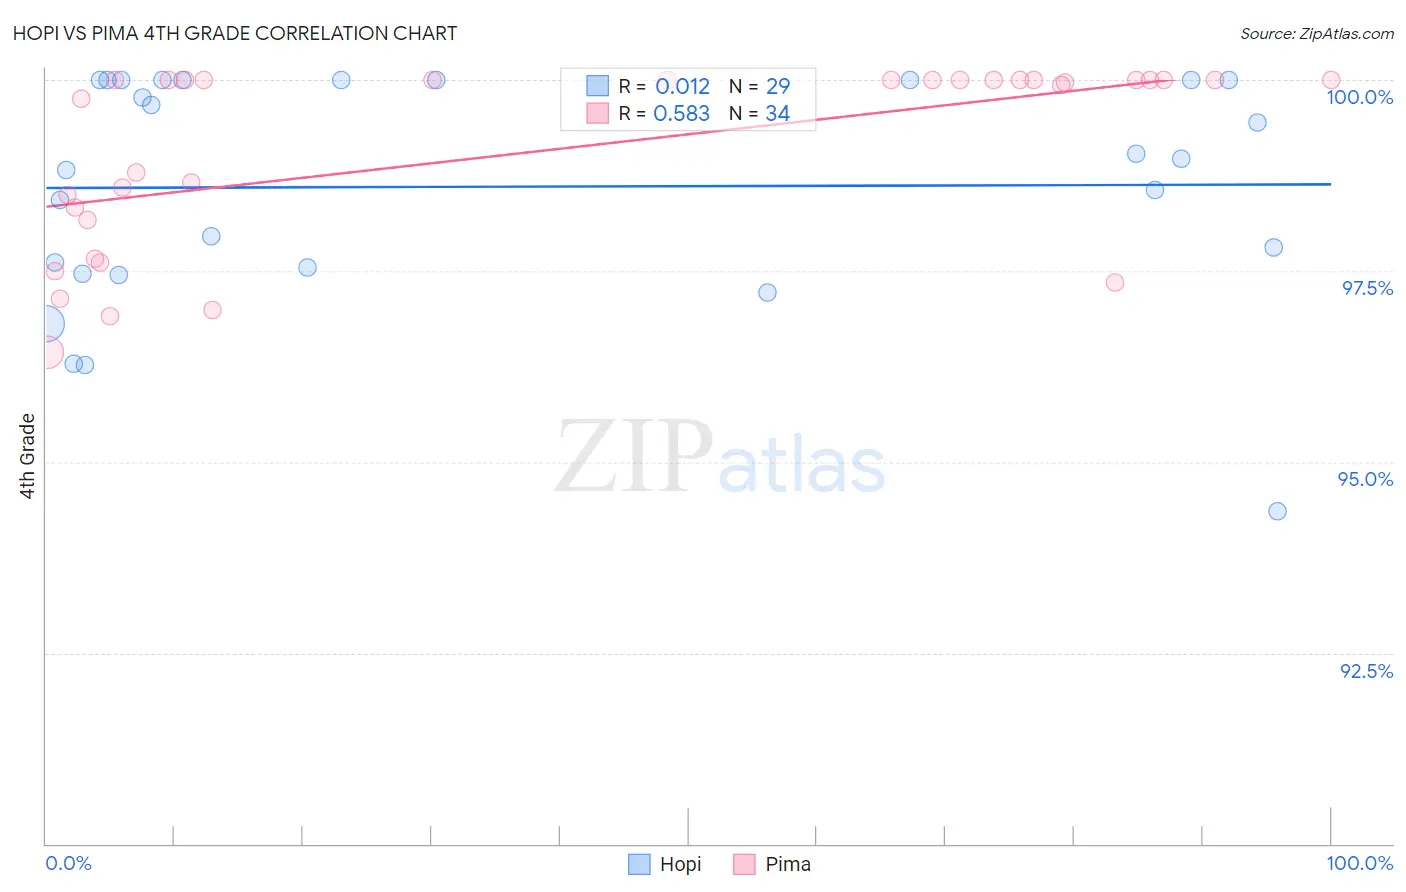
Hopi vs Pima 4th Grade Correlation Chart
The statistical analysis conducted on geographies consisting of 74,739,957 people shows no correlation between the proportion of Hopi and percentage of population with at least 4th grade education in the United States with a correlation coefficient (R) of 0.012 and weighted average of 97.7%. Similarly, the statistical analysis conducted on geographies consisting of 61,552,942 people shows a substantial positive correlation between the proportion of Pima and percentage of population with at least 4th grade education in the United States with a correlation coefficient (R) of 0.583 and weighted average of 97.7%, a difference of 0.10%.
4th Grade Correlation Summary
| Measurement | Hopi | Pima |
| Minimum | 94.4% | 96.4% |
| Maximum | 100.0% | 100.0% |
| Range | 5.6% | 3.6% |
| Mean | 98.6% | 99.1% |
| Median | 99.0% | 100.0% |
| Interquartile 25% (IQ1) | 97.5% | 98.2% |
| Interquartile 75% (IQ3) | 100.0% | 100.0% |
| Interquartile Range (IQR) | 2.5% | 1.8% |
| Standard Deviation (Sample) | 1.5% | 1.2% |
| Standard Deviation (Population) | 1.5% | 1.2% |
Demographics Similar to Hopi and Pima by 4th Grade
In terms of 4th grade, the demographic groups most similar to Hopi are Jordanian (97.7%, a difference of 0.0%), Ute (97.7%, a difference of 0.0%), Burmese (97.7%, a difference of 0.010%), Spaniard (97.7%, a difference of 0.010%), and Immigrants from Moldova (97.7%, a difference of 0.010%). Similarly, the demographic groups most similar to Pima are Immigrants from Bulgaria (97.7%, a difference of 0.010%), Immigrants from Romania (97.7%, a difference of 0.020%), Immigrants from Kuwait (97.7%, a difference of 0.030%), Immigrants from Hungary (97.7%, a difference of 0.030%), and Hmong (97.7%, a difference of 0.040%).
| Demographics | Rating | Rank | 4th Grade |
| Pima | 92.0 /100 | #128 | Exceptional 97.7% |
| Immigrants | Bulgaria | 91.3 /100 | #129 | Exceptional 97.7% |
| Immigrants | Romania | 90.6 /100 | #130 | Exceptional 97.7% |
| Immigrants | Kuwait | 89.7 /100 | #131 | Excellent 97.7% |
| Immigrants | Hungary | 89.3 /100 | #132 | Excellent 97.7% |
| Hmong | 88.2 /100 | #133 | Excellent 97.7% |
| Palestinians | 88.1 /100 | #134 | Excellent 97.7% |
| Cambodians | 87.8 /100 | #135 | Excellent 97.7% |
| Israelis | 86.2 /100 | #136 | Excellent 97.7% |
| Immigrants | Turkey | 86.0 /100 | #137 | Excellent 97.7% |
| Blackfeet | 86.0 /100 | #138 | Excellent 97.7% |
| Seminole | 84.7 /100 | #139 | Excellent 97.7% |
| Filipinos | 84.0 /100 | #140 | Excellent 97.7% |
| Immigrants | Greece | 83.8 /100 | #141 | Excellent 97.7% |
| Immigrants | North Macedonia | 83.3 /100 | #142 | Excellent 97.7% |
| Burmese | 82.8 /100 | #143 | Excellent 97.7% |
| Spaniards | 82.7 /100 | #144 | Excellent 97.7% |
| Immigrants | Moldova | 82.4 /100 | #145 | Excellent 97.7% |
| Jordanians | 81.3 /100 | #146 | Excellent 97.7% |
| Ute | 80.6 /100 | #147 | Excellent 97.7% |
| Hopi | 80.6 /100 | #148 | Excellent 97.7% |