Immigrants from Afghanistan vs Alaska Native 4th Grade

COMPARE

Immigrants from Afghanistan
Race
Ancestry
AfghanAfricanAlaskan AthabascanAlbanianAleutAlsatianAmericanApacheArabArapahoArgentineanArmenianAssyrian/Chaldean/SyriacAustralianAustrianBahamianBangladeshiBarbadianBasqueBelgianBelizeanBermudanBhutaneseBlackfeetBolivianBrazilianBritishBritish West IndianBulgarianBurmeseCajunCambodianCanadianCape VerdeanCarpatho RusynCelticCentral AmericanCentral American IndianCherokeeCheyenneChickasawChileanChineseChippewaChoctawColombianColvilleComancheCosta RicanCreeCreekCroatianCrowCubanCypriotCzechCzechoslovakianDanishDelawareDominicanDutchDutch West IndianEastern EuropeanEcuadorianEgyptianEnglishEstonianEthiopianEuropeanFijianFilipinoFinnishFrenchFrench American IndianFrench CanadianGermanGerman RussianGhanaianGreekGuamanian/ChamorroGuatemalanGuyaneseHaitianHmongHonduranHopiHoumaHungarianIcelanderIndian (Asian)IndonesianInupiatIranianIraqiIrishIroquoisIsraeliItalianJamaicanJapaneseJordanianKenyanKiowaKoreanLaotianLatvianLebaneseLiberianLithuanianLumbeeLuxembourgerMacedonianMalaysianMalteseMarshalleseMenomineeMexicanMexican American IndianMongolianMoroccanNative HawaiianNavajoNepaleseNew ZealanderNicaraguanNigerianNorthern EuropeanNorwegianOkinawanOsageOttawaPaiutePakistaniPalestinianPanamanianParaguayanPennsylvania GermanPeruvianPimaPolishPortuguesePotawatomiPuebloPuerto RicanPuget Sound SalishRomanianRussianSalvadoranSamoanScandinavianScotch-IrishScottishSeminoleSenegaleseSerbianShoshoneSierra LeoneanSiouxSlavicSlovakSloveneSomaliSouth AfricanSouth AmericanSouth American IndianSoviet UnionSpaniardSpanishSpanish AmericanSpanish American IndianSri LankanSubsaharan AfricanSudaneseSwedishSwissSyrianTaiwaneseThaiTlingit-HaidaTohono O'OdhamTonganTrinidadian and TobagonianTsimshianTurkishU.S. Virgin IslanderUgandanUkrainianUruguayanUteVenezuelanVietnameseWelshWest IndianYakamaYaquiYugoslavianYumanYup'ikZimbabwean
Immigration
NonimmigrantsImmigrantsAfghanistanAfricaAlbaniaArgentinaArmeniaAsiaAustraliaAustriaBahamasBangladeshBarbadosBelarusBelgiumBelizeBoliviaBosnia and HerzegovinaBrazilBulgariaBurma/MyanmarCabo VerdeCambodiaCameroonCanadaCaribbeanCentral AmericaChileChinaColombiaCongoCosta RicaCroatiaCubaCzechoslovakiaDenmarkDominicaDominican RepublicEastern AfricaEastern AsiaEastern EuropeEcuadorEgyptEl SalvadorEnglandEritreaEthiopiaEuropeFijiFranceGermanyGhanaGreeceGrenadaGuatemalaGuyanaHaitiHondurasHong KongHungaryIndiaIndonesiaIranIraqIrelandIsraelItalyJamaicaJapanJordanKazakhstanKenyaKoreaKuwaitLaosLatin AmericaLatviaLebanonLiberiaLithuaniaMalaysiaMexicoMicronesiaMiddle AfricaMoldovaMoroccoNepalNetherlandsNicaraguaNigeriaNorth AmericaNorth MacedoniaNorthern AfricaNorthern EuropeNorwayOceaniaPakistanPanamaPeruPhilippinesPolandPortugalRomaniaRussiaSaudi ArabiaScotlandSenegalSerbiaSierra LeoneSingaporeSomaliaSouth AfricaSouth AmericaSouth Central AsiaSouth Eastern AsiaSouthern EuropeSpainSri LankaSt. Vincent and the GrenadinesSudanSwedenSwitzerlandSyriaTaiwanThailandTrinidad and TobagoTurkeyUgandaUkraineUruguayUzbekistanVenezuelaVietnamWest IndiesWestern AfricaWestern AsiaWestern EuropeYemenZaireZimbabweAzores
Alaska Native
Race
Ancestry
AfghanAfricanAlaska NativeAlaskan AthabascanAlbanianAleutAlsatianAmericanApacheArabArapahoArgentineanArmenianAssyrian/Chaldean/SyriacAustralianAustrianBahamianBangladeshiBarbadianBasqueBelgianBelizeanBermudanBhutaneseBlackfeetBolivianBrazilianBritishBritish West IndianBulgarianBurmeseCajunCambodianCanadianCape VerdeanCarpatho RusynCelticCentral AmericanCentral American IndianCherokeeCheyenneChickasawChileanChineseChippewaChoctawColombianColvilleComancheCosta RicanCreeCreekCroatianCrowCubanCypriotCzechCzechoslovakianDanishDelawareDominicanDutchDutch West IndianEastern EuropeanEcuadorianEgyptianEnglishEstonianEthiopianEuropeanFijianFilipinoFinnishFrenchFrench American IndianFrench CanadianGermanGerman RussianGhanaianGreekGuamanian/ChamorroGuatemalanGuyaneseHaitianHmongHonduranHopiHoumaHungarianIcelanderIndian (Asian)IndonesianInupiatIranianIraqiIrishIroquoisIsraeliItalianJamaicanJapaneseJordanianKenyanKiowaKoreanLaotianLatvianLebaneseLiberianLithuanianLumbeeLuxembourgerMacedonianMalaysianMalteseMarshalleseMenomineeMexicanMexican American IndianMongolianMoroccanNative HawaiianNavajoNepaleseNew ZealanderNicaraguanNigerianNorthern EuropeanNorwegianOkinawanOsageOttawaPaiutePakistaniPalestinianPanamanianParaguayanPennsylvania GermanPeruvianPimaPolishPortuguesePotawatomiPuebloPuerto RicanPuget Sound SalishRomanianRussianSalvadoranSamoanScandinavianScotch-IrishScottishSeminoleSenegaleseSerbianShoshoneSierra LeoneanSiouxSlavicSlovakSloveneSomaliSouth AfricanSouth AmericanSouth American IndianSoviet UnionSpaniardSpanishSpanish AmericanSpanish American IndianSri LankanSubsaharan AfricanSudaneseSwedishSwissSyrianTaiwaneseThaiTlingit-HaidaTohono O'OdhamTonganTrinidadian and TobagonianTsimshianTurkishU.S. Virgin IslanderUgandanUkrainianUruguayanUteVenezuelanVietnameseWelshWest IndianYakamaYaquiYugoslavianYumanYup'ikZimbabwean
Immigration
NonimmigrantsImmigrantsAfricaAlbaniaArgentinaArmeniaAsiaAustraliaAustriaBahamasBangladeshBarbadosBelarusBelgiumBelizeBoliviaBosnia and HerzegovinaBrazilBulgariaBurma/MyanmarCabo VerdeCambodiaCameroonCanadaCaribbeanCentral AmericaChileChinaColombiaCongoCosta RicaCroatiaCubaCzechoslovakiaDenmarkDominicaDominican RepublicEastern AfricaEastern AsiaEastern EuropeEcuadorEgyptEl SalvadorEnglandEritreaEthiopiaEuropeFijiFranceGermanyGhanaGreeceGrenadaGuatemalaGuyanaHaitiHondurasHong KongHungaryIndiaIndonesiaIranIraqIrelandIsraelItalyJamaicaJapanJordanKazakhstanKenyaKoreaKuwaitLaosLatin AmericaLatviaLebanonLiberiaLithuaniaMalaysiaMexicoMicronesiaMiddle AfricaMoldovaMoroccoNepalNetherlandsNicaraguaNigeriaNorth AmericaNorth MacedoniaNorthern AfricaNorthern EuropeNorwayOceaniaPakistanPanamaPeruPhilippinesPolandPortugalRomaniaRussiaSaudi ArabiaScotlandSenegalSerbiaSierra LeoneSingaporeSomaliaSouth AfricaSouth AmericaSouth Central AsiaSouth Eastern AsiaSouthern EuropeSpainSri LankaSt. Vincent and the GrenadinesSudanSwedenSwitzerlandSyriaTaiwanThailandTrinidad and TobagoTurkeyUgandaUkraineUruguayUzbekistanVenezuelaVietnamWest IndiesWestern AfricaWestern AsiaWestern EuropeYemenZaireZimbabweAzores
4th Grade
Income
Poverty
Unemployment
Labor Participation
Family Structure
Vehicle Availability
Education Level
Disability

4th Grade Comparison

Immigrants from Afghanistan

Alaska Natives

Tragic
Exceptional
96.8%
4TH GRADE
0.0/ 100
METRIC RATING
288th/ 347
METRIC RANK
98.4%
4TH GRADE
100.0/ 100
METRIC RATING
20th/ 347
METRIC RANK

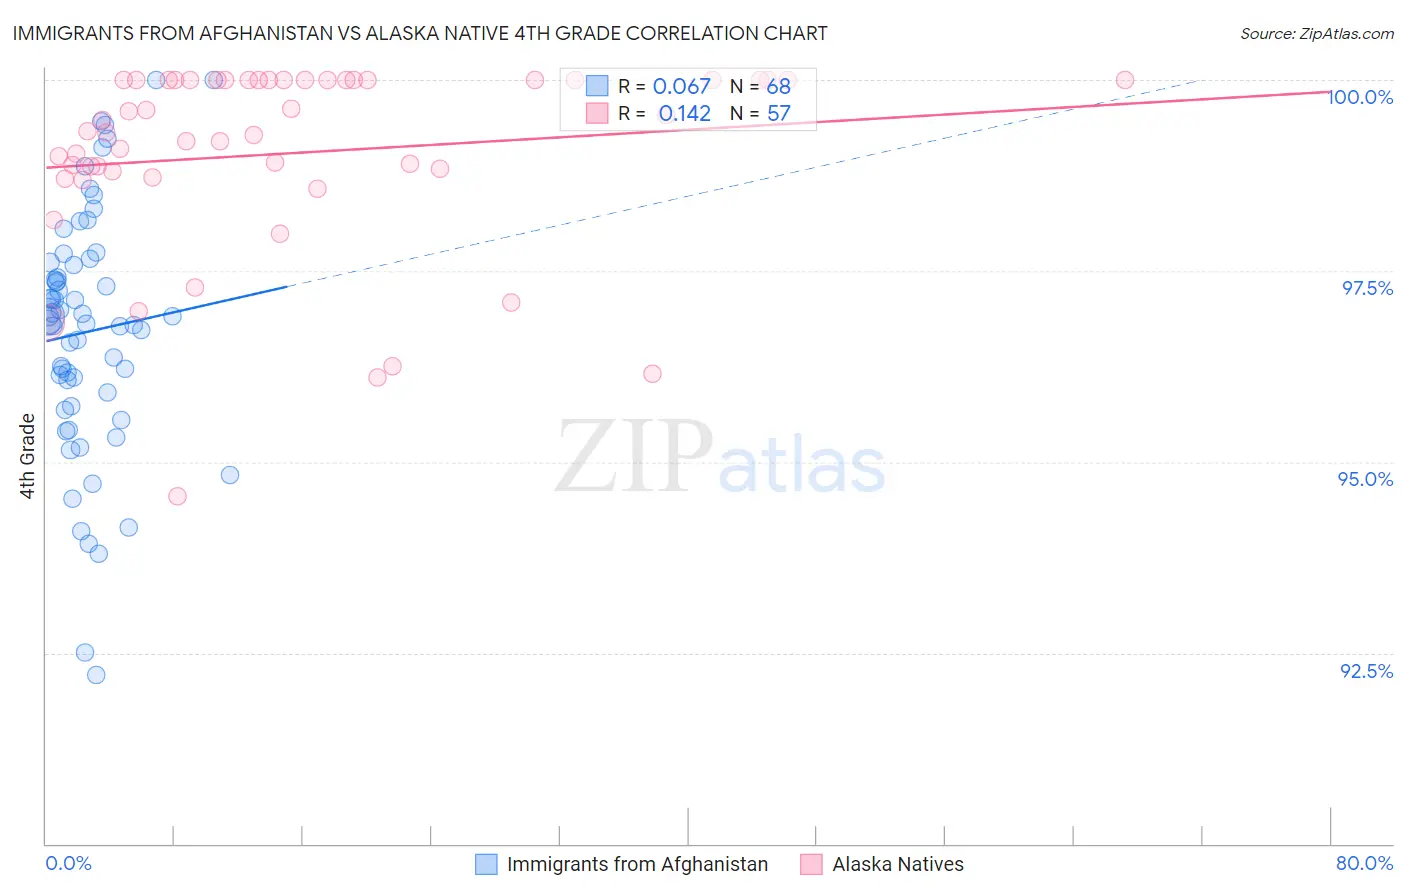
Immigrants from Afghanistan vs Alaska Native 4th Grade Correlation Chart

The statistical analysis conducted on geographies consisting of 147,629,924 people shows a slight positive correlation between the proportion of Immigrants from Afghanistan and percentage of population with at least 4th grade education in the United States with a correlation coefficient (R) of 0.067 and weighted average of 96.8%. Similarly, the statistical analysis conducted on geographies consisting of 76,775,774 people shows a poor positive correlation between the proportion of Alaska Natives and percentage of population with at least 4th grade education in the United States with a correlation coefficient (R) of 0.142 and weighted average of 98.4%, a difference of 1.6%.
Immigrants from Afghanistan vs Alaska Native 4th Grade

4th Grade Correlation Summary

MeasurementImmigrants from AfghanistanAlaska Native
Minimum92.2%94.6%
Maximum100.0%100.0%
Range7.8%5.4%
Mean96.7%99.0%
Median96.9%99.3%
Interquartile 25% (IQ1)95.8%98.8%
Interquartile 75% (IQ3)97.6%100.0%
Interquartile Range (IQR)1.8%1.2%
Standard Deviation (Sample)1.6%1.2%
Standard Deviation (Population)1.6%1.2%

Similar Demographics by 4th Grade

Demographics Similar to Immigrants from Afghanistan by 4th Grade

In terms of 4th grade, the demographic groups most similar to Immigrants from Afghanistan are Houma (96.8%, a difference of 0.0%), Immigrants from West Indies (96.7%, a difference of 0.020%), British West Indian (96.7%, a difference of 0.030%), Immigrants from Barbados (96.8%, a difference of 0.040%), and Immigrants from Thailand (96.8%, a difference of 0.040%).
DemographicsRating | Rank4th Grade
Immigrants | Hong Kong
0.1
/100
|
#281
Tragic
96.9%
Immigrants | Trinidad and Tobago
0.1
/100
|
#282
Tragic
96.8%
Immigrants | Philippines
0.1
/100
|
#283
Tragic
96.8%
Immigrants | St. Vincent and the Grenadines
0.1
/100
|
#284
Tragic
96.8%
Immigrants | Barbados
0.0
/100
|
#285
Tragic
96.8%
Immigrants | Thailand
0.0
/100
|
#286
Tragic
96.8%
Houma
0.0
/100
|
#287
Tragic
96.8%
Immigrants | Afghanistan
0.0
/100
|
#288
Tragic
96.8%
Immigrants | West Indies
0.0
/100
|
#289
Tragic
96.7%
British West Indians
0.0
/100
|
#290
Tragic
96.7%
Immigrants | Grenada
0.0
/100
|
#291
Tragic
96.7%
Malaysians
0.0
/100
|
#292
Tragic
96.7%
Puerto Ricans
0.0
/100
|
#293
Tragic
96.7%
Immigrants | Eritrea
0.0
/100
|
#294
Tragic
96.7%
Immigrants | Portugal
0.0
/100
|
#295
Tragic
96.6%

Demographics Similar to Alaska Natives by 4th Grade

In terms of 4th grade, the demographic groups most similar to Alaska Natives are Polish (98.4%, a difference of 0.010%), Irish (98.4%, a difference of 0.010%), Lithuanian (98.3%, a difference of 0.010%), Finnish (98.3%, a difference of 0.010%), and Dutch (98.4%, a difference of 0.020%).
DemographicsRating | Rank4th Grade
Swedes
100.0
/100
|
#13
Exceptional
98.4%
Carpatho Rusyns
100.0
/100
|
#14
Exceptional
98.4%
Dutch
100.0
/100
|
#15
Exceptional
98.4%
Scottish
100.0
/100
|
#16
Exceptional
98.4%
Pennsylvania Germans
100.0
/100
|
#17
Exceptional
98.4%
Poles
100.0
/100
|
#18
Exceptional
98.4%
Irish
100.0
/100
|
#19
Exceptional
98.4%
Alaska Natives
100.0
/100
|
#20
Exceptional
98.4%
Lithuanians
100.0
/100
|
#21
Exceptional
98.3%
Finns
100.0
/100
|
#22
Exceptional
98.3%
Sioux
100.0
/100
|
#23
Exceptional
98.3%
Danes
100.0
/100
|
#24
Exceptional
98.3%
Scotch-Irish
100.0
/100
|
#25
Exceptional
98.3%
Croatians
100.0
/100
|
#26
Exceptional
98.3%
French Canadians
100.0
/100
|
#27
Exceptional
98.3%