Dominican vs Pima 4th Grade
COMPARE
Dominican
Pima
4th Grade
4th Grade Comparison
Dominicans
Pima
96.0%
4TH GRADE
0.0/ 100
METRIC RATING
325th/ 347
METRIC RANK
97.7%
4TH GRADE
92.0/ 100
METRIC RATING
128th/ 347
METRIC RANK
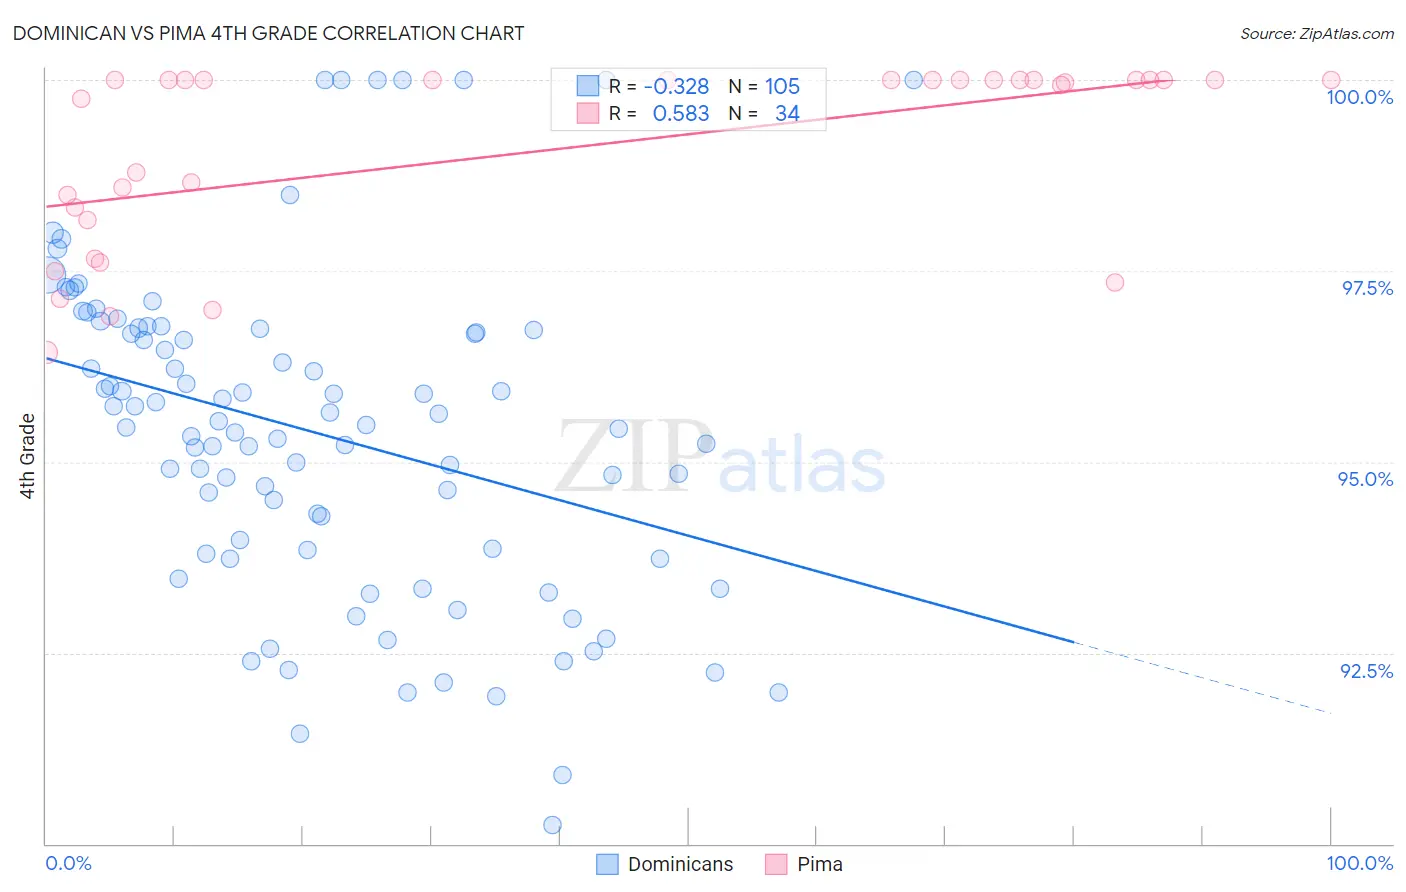
Dominican vs Pima 4th Grade Correlation Chart
The statistical analysis conducted on geographies consisting of 355,142,603 people shows a mild negative correlation between the proportion of Dominicans and percentage of population with at least 4th grade education in the United States with a correlation coefficient (R) of -0.328 and weighted average of 96.0%. Similarly, the statistical analysis conducted on geographies consisting of 61,552,942 people shows a substantial positive correlation between the proportion of Pima and percentage of population with at least 4th grade education in the United States with a correlation coefficient (R) of 0.583 and weighted average of 97.7%, a difference of 1.8%.
4th Grade Correlation Summary
| Measurement | Dominican | Pima |
| Minimum | 90.2% | 96.4% |
| Maximum | 100.0% | 100.0% |
| Range | 9.8% | 3.6% |
| Mean | 95.4% | 99.1% |
| Median | 95.5% | 100.0% |
| Interquartile 25% (IQ1) | 93.8% | 98.2% |
| Interquartile 75% (IQ3) | 96.7% | 100.0% |
| Interquartile Range (IQR) | 2.9% | 1.8% |
| Standard Deviation (Sample) | 2.1% | 1.2% |
| Standard Deviation (Population) | 2.1% | 1.2% |
Similar Demographics by 4th Grade
Demographics Similar to Dominicans by 4th Grade
In terms of 4th grade, the demographic groups most similar to Dominicans are Immigrants from Belize (96.0%, a difference of 0.010%), Hispanic or Latino (96.0%, a difference of 0.010%), Immigrants from Nicaragua (96.0%, a difference of 0.020%), Honduran (96.0%, a difference of 0.020%), and Japanese (96.0%, a difference of 0.040%).
| Demographics | Rating | Rank | 4th Grade |
| Immigrants | Azores | 0.0 /100 | #318 | Tragic 96.1% |
| Belizeans | 0.0 /100 | #319 | Tragic 96.1% |
| Bangladeshis | 0.0 /100 | #320 | Tragic 96.1% |
| Japanese | 0.0 /100 | #321 | Tragic 96.0% |
| Immigrants | Vietnam | 0.0 /100 | #322 | Tragic 96.0% |
| Immigrants | Nicaragua | 0.0 /100 | #323 | Tragic 96.0% |
| Immigrants | Belize | 0.0 /100 | #324 | Tragic 96.0% |
| Dominicans | 0.0 /100 | #325 | Tragic 96.0% |
| Hispanics or Latinos | 0.0 /100 | #326 | Tragic 96.0% |
| Hondurans | 0.0 /100 | #327 | Tragic 96.0% |
| Mexican American Indians | 0.0 /100 | #328 | Tragic 95.8% |
| Immigrants | Cambodia | 0.0 /100 | #329 | Tragic 95.8% |
| Immigrants | Fiji | 0.0 /100 | #330 | Tragic 95.8% |
| Immigrants | Armenia | 0.0 /100 | #331 | Tragic 95.8% |
| Immigrants | Honduras | 0.0 /100 | #332 | Tragic 95.8% |
Demographics Similar to Pima by 4th Grade
In terms of 4th grade, the demographic groups most similar to Pima are Colville (97.7%, a difference of 0.0%), Immigrants from Serbia (97.8%, a difference of 0.010%), Immigrants from Europe (97.8%, a difference of 0.010%), Immigrants from Bulgaria (97.7%, a difference of 0.010%), and Spanish (97.8%, a difference of 0.020%).
| Demographics | Rating | Rank | 4th Grade |
| Immigrants | Norway | 94.2 /100 | #121 | Exceptional 97.8% |
| Immigrants | Japan | 94.1 /100 | #122 | Exceptional 97.8% |
| Immigrants | Zimbabwe | 93.9 /100 | #123 | Exceptional 97.8% |
| Spanish | 93.7 /100 | #124 | Exceptional 97.8% |
| Immigrants | Serbia | 92.6 /100 | #125 | Exceptional 97.8% |
| Immigrants | Europe | 92.5 /100 | #126 | Exceptional 97.8% |
| Colville | 92.3 /100 | #127 | Exceptional 97.7% |
| Pima | 92.0 /100 | #128 | Exceptional 97.7% |
| Immigrants | Bulgaria | 91.3 /100 | #129 | Exceptional 97.7% |
| Immigrants | Romania | 90.6 /100 | #130 | Exceptional 97.7% |
| Immigrants | Kuwait | 89.7 /100 | #131 | Excellent 97.7% |
| Immigrants | Hungary | 89.3 /100 | #132 | Excellent 97.7% |
| Hmong | 88.2 /100 | #133 | Excellent 97.7% |
| Palestinians | 88.1 /100 | #134 | Excellent 97.7% |
| Cambodians | 87.8 /100 | #135 | Excellent 97.7% |