Immigrants from Denmark vs Menominee GED/Equivalency
COMPARE
Immigrants from Denmark
Menominee
GED/Equivalency
GED/Equivalency Comparison
Immigrants from Denmark
Menominee
88.0%
GED/EQUIVALENCY
99.4/ 100
METRIC RATING
56th/ 347
METRIC RANK
86.3%
GED/EQUIVALENCY
79.3/ 100
METRIC RATING
149th/ 347
METRIC RANK
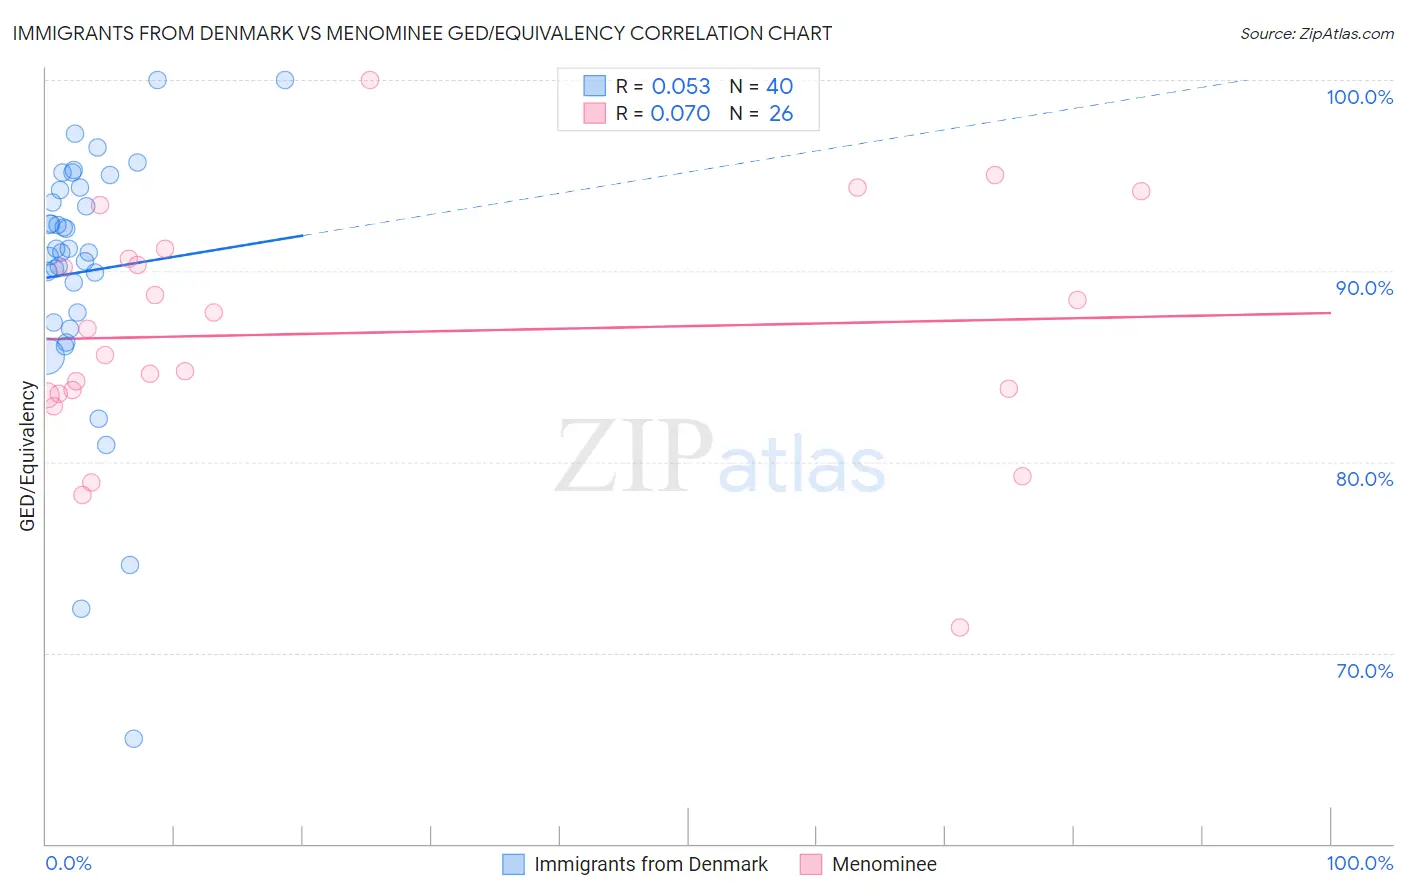
Immigrants from Denmark vs Menominee GED/Equivalency Correlation Chart
The statistical analysis conducted on geographies consisting of 136,430,715 people shows a slight positive correlation between the proportion of Immigrants from Denmark and percentage of population with at least ged/equivalency education in the United States with a correlation coefficient (R) of 0.053 and weighted average of 88.0%. Similarly, the statistical analysis conducted on geographies consisting of 45,778,979 people shows a slight positive correlation between the proportion of Menominee and percentage of population with at least ged/equivalency education in the United States with a correlation coefficient (R) of 0.070 and weighted average of 86.3%, a difference of 1.9%.
GED/Equivalency Correlation Summary
| Measurement | Immigrants from Denmark | Menominee |
| Minimum | 65.5% | 71.3% |
| Maximum | 100.0% | 100.0% |
| Range | 34.5% | 28.7% |
| Mean | 90.0% | 86.8% |
| Median | 91.1% | 86.3% |
| Interquartile 25% (IQ1) | 87.6% | 83.6% |
| Interquartile 75% (IQ3) | 94.3% | 90.6% |
| Interquartile Range (IQR) | 6.7% | 7.1% |
| Standard Deviation (Sample) | 7.0% | 6.2% |
| Standard Deviation (Population) | 6.9% | 6.1% |
Similar Demographics by GED/Equivalency
Demographics Similar to Immigrants from Denmark by GED/Equivalency
In terms of ged/equivalency, the demographic groups most similar to Immigrants from Denmark are Soviet Union (88.0%, a difference of 0.020%), New Zealander (88.0%, a difference of 0.020%), Immigrants from Netherlands (88.0%, a difference of 0.030%), Zimbabwean (88.0%, a difference of 0.030%), and Immigrants from South Africa (88.0%, a difference of 0.030%).
| Demographics | Rating | Rank | GED/Equivalency |
| Australians | 99.5 /100 | #49 | Exceptional 88.1% |
| Immigrants | Korea | 99.5 /100 | #50 | Exceptional 88.1% |
| Immigrants | Netherlands | 99.4 /100 | #51 | Exceptional 88.0% |
| Zimbabweans | 99.4 /100 | #52 | Exceptional 88.0% |
| Immigrants | South Africa | 99.4 /100 | #53 | Exceptional 88.0% |
| Soviet Union | 99.4 /100 | #54 | Exceptional 88.0% |
| New Zealanders | 99.4 /100 | #55 | Exceptional 88.0% |
| Immigrants | Denmark | 99.4 /100 | #56 | Exceptional 88.0% |
| Immigrants | Czechoslovakia | 99.3 /100 | #57 | Exceptional 87.9% |
| Northern Europeans | 99.3 /100 | #58 | Exceptional 87.9% |
| Serbians | 99.3 /100 | #59 | Exceptional 87.9% |
| Scandinavians | 99.3 /100 | #60 | Exceptional 87.9% |
| Europeans | 99.3 /100 | #61 | Exceptional 87.9% |
| Germans | 99.3 /100 | #62 | Exceptional 87.9% |
| Immigrants | Turkey | 99.2 /100 | #63 | Exceptional 87.9% |
Demographics Similar to Menominee by GED/Equivalency
In terms of ged/equivalency, the demographic groups most similar to Menominee are Immigrants from Northern Africa (86.3%, a difference of 0.0%), Immigrants from Poland (86.3%, a difference of 0.0%), Basque (86.4%, a difference of 0.010%), Immigrants from Western Asia (86.3%, a difference of 0.010%), and Pakistani (86.4%, a difference of 0.040%).
| Demographics | Rating | Rank | GED/Equivalency |
| Immigrants | Indonesia | 82.4 /100 | #142 | Excellent 86.4% |
| Immigrants | Pakistan | 82.4 /100 | #143 | Excellent 86.4% |
| Bolivians | 82.1 /100 | #144 | Excellent 86.4% |
| Pakistanis | 80.4 /100 | #145 | Excellent 86.4% |
| Basques | 79.5 /100 | #146 | Good 86.4% |
| Immigrants | Northern Africa | 79.3 /100 | #147 | Good 86.3% |
| Immigrants | Poland | 79.3 /100 | #148 | Good 86.3% |
| Menominee | 79.3 /100 | #149 | Good 86.3% |
| Immigrants | Western Asia | 78.8 /100 | #150 | Good 86.3% |
| Immigrants | Bosnia and Herzegovina | 77.9 /100 | #151 | Good 86.3% |
| Brazilians | 77.2 /100 | #152 | Good 86.3% |
| Kenyans | 76.6 /100 | #153 | Good 86.3% |
| Armenians | 76.4 /100 | #154 | Good 86.3% |
| Iraqis | 75.2 /100 | #155 | Good 86.2% |
| Immigrants | Nepal | 73.3 /100 | #156 | Good 86.2% |