Central American vs Menominee GED/Equivalency
COMPARE
Central American
Menominee
GED/Equivalency
GED/Equivalency Comparison
Central Americans
Menominee
79.2%
GED/EQUIVALENCY
0.0/ 100
METRIC RATING
327th/ 347
METRIC RANK
86.3%
GED/EQUIVALENCY
79.3/ 100
METRIC RATING
149th/ 347
METRIC RANK
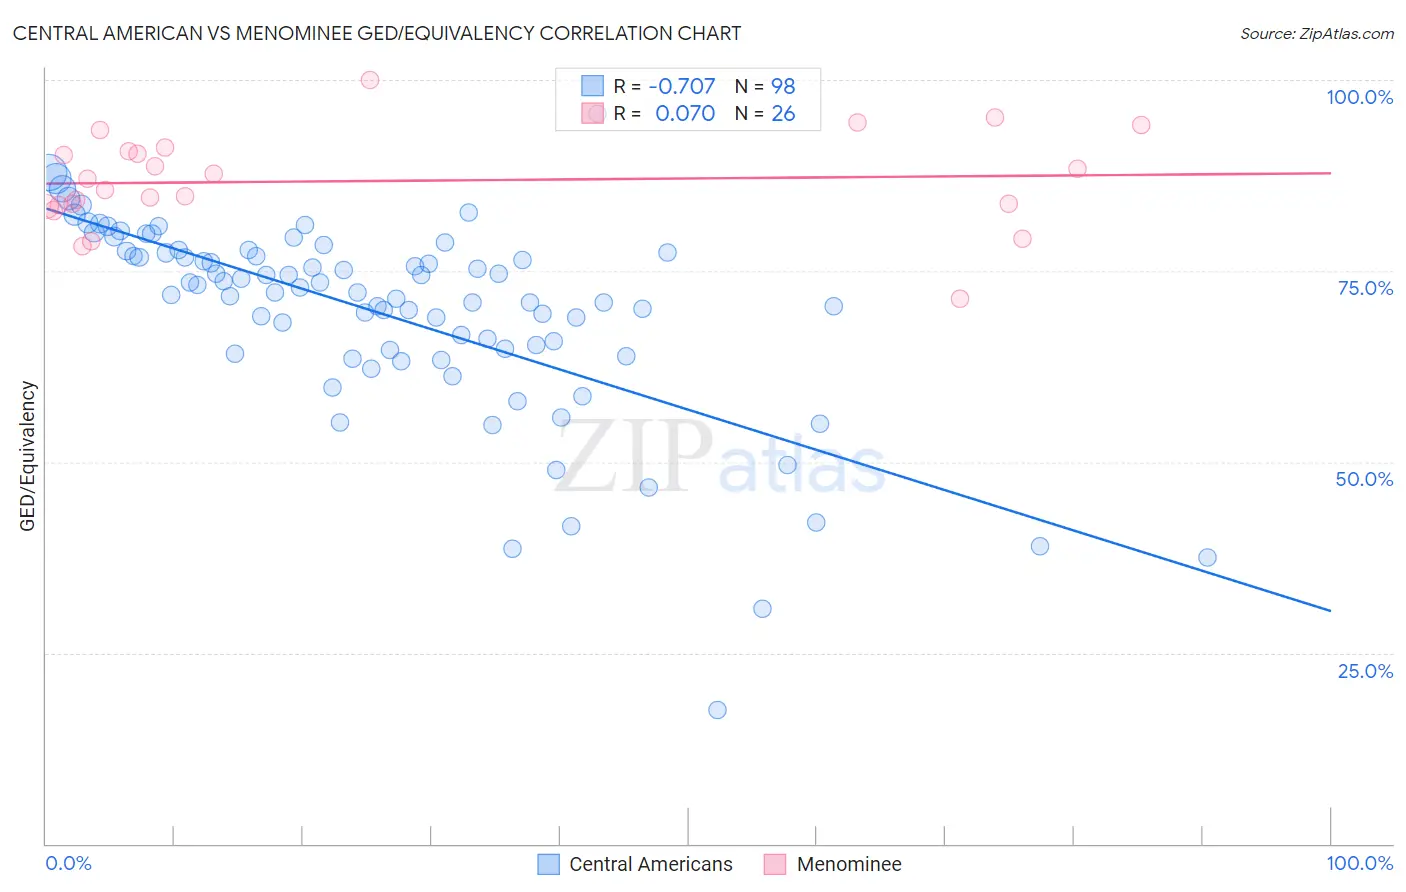
Central American vs Menominee GED/Equivalency Correlation Chart
The statistical analysis conducted on geographies consisting of 504,618,995 people shows a strong negative correlation between the proportion of Central Americans and percentage of population with at least ged/equivalency education in the United States with a correlation coefficient (R) of -0.707 and weighted average of 79.2%. Similarly, the statistical analysis conducted on geographies consisting of 45,778,979 people shows a slight positive correlation between the proportion of Menominee and percentage of population with at least ged/equivalency education in the United States with a correlation coefficient (R) of 0.070 and weighted average of 86.3%, a difference of 9.0%.
GED/Equivalency Correlation Summary
| Measurement | Central American | Menominee |
| Minimum | 17.6% | 71.3% |
| Maximum | 95.6% | 100.0% |
| Range | 78.0% | 28.7% |
| Mean | 69.4% | 86.8% |
| Median | 72.5% | 86.3% |
| Interquartile 25% (IQ1) | 64.6% | 83.6% |
| Interquartile 75% (IQ3) | 77.4% | 90.6% |
| Interquartile Range (IQR) | 12.8% | 7.1% |
| Standard Deviation (Sample) | 13.0% | 6.2% |
| Standard Deviation (Population) | 13.0% | 6.1% |
Similar Demographics by GED/Equivalency
Demographics Similar to Central Americans by GED/Equivalency
In terms of ged/equivalency, the demographic groups most similar to Central Americans are Yuman (79.2%, a difference of 0.020%), Hispanic or Latino (79.1%, a difference of 0.10%), Honduran (79.3%, a difference of 0.11%), Dominican (79.1%, a difference of 0.15%), and Mexican American Indian (79.4%, a difference of 0.23%).
| Demographics | Rating | Rank | GED/Equivalency |
| Immigrants | Cuba | 0.0 /100 | #320 | Tragic 80.2% |
| Yup'ik | 0.0 /100 | #321 | Tragic 80.0% |
| Lumbee | 0.0 /100 | #322 | Tragic 80.0% |
| Immigrants | Nicaragua | 0.0 /100 | #323 | Tragic 79.9% |
| Mexican American Indians | 0.0 /100 | #324 | Tragic 79.4% |
| Hondurans | 0.0 /100 | #325 | Tragic 79.3% |
| Yuman | 0.0 /100 | #326 | Tragic 79.2% |
| Central Americans | 0.0 /100 | #327 | Tragic 79.2% |
| Hispanics or Latinos | 0.0 /100 | #328 | Tragic 79.1% |
| Dominicans | 0.0 /100 | #329 | Tragic 79.1% |
| Immigrants | Cabo Verde | 0.0 /100 | #330 | Tragic 78.9% |
| Immigrants | Honduras | 0.0 /100 | #331 | Tragic 78.7% |
| Immigrants | Azores | 0.0 /100 | #332 | Tragic 78.7% |
| Salvadorans | 0.0 /100 | #333 | Tragic 78.6% |
| Guatemalans | 0.0 /100 | #334 | Tragic 78.5% |
Demographics Similar to Menominee by GED/Equivalency
In terms of ged/equivalency, the demographic groups most similar to Menominee are Immigrants from Northern Africa (86.3%, a difference of 0.0%), Immigrants from Poland (86.3%, a difference of 0.0%), Basque (86.4%, a difference of 0.010%), Immigrants from Western Asia (86.3%, a difference of 0.010%), and Pakistani (86.4%, a difference of 0.040%).
| Demographics | Rating | Rank | GED/Equivalency |
| Immigrants | Indonesia | 82.4 /100 | #142 | Excellent 86.4% |
| Immigrants | Pakistan | 82.4 /100 | #143 | Excellent 86.4% |
| Bolivians | 82.1 /100 | #144 | Excellent 86.4% |
| Pakistanis | 80.4 /100 | #145 | Excellent 86.4% |
| Basques | 79.5 /100 | #146 | Good 86.4% |
| Immigrants | Northern Africa | 79.3 /100 | #147 | Good 86.3% |
| Immigrants | Poland | 79.3 /100 | #148 | Good 86.3% |
| Menominee | 79.3 /100 | #149 | Good 86.3% |
| Immigrants | Western Asia | 78.8 /100 | #150 | Good 86.3% |
| Immigrants | Bosnia and Herzegovina | 77.9 /100 | #151 | Good 86.3% |
| Brazilians | 77.2 /100 | #152 | Good 86.3% |
| Kenyans | 76.6 /100 | #153 | Good 86.3% |
| Armenians | 76.4 /100 | #154 | Good 86.3% |
| Iraqis | 75.2 /100 | #155 | Good 86.2% |
| Immigrants | Nepal | 73.3 /100 | #156 | Good 86.2% |