Danish vs Immigrants from Uruguay High School Diploma
COMPARE
Danish
Immigrants from Uruguay
High School Diploma
High School Diploma Comparison
Danes
Immigrants from Uruguay
91.8%
HIGH SCHOOL DIPLOMA
100.0/ 100
METRIC RATING
13th/ 347
METRIC RANK
87.6%
HIGH SCHOOL DIPLOMA
1.0/ 100
METRIC RATING
253rd/ 347
METRIC RANK
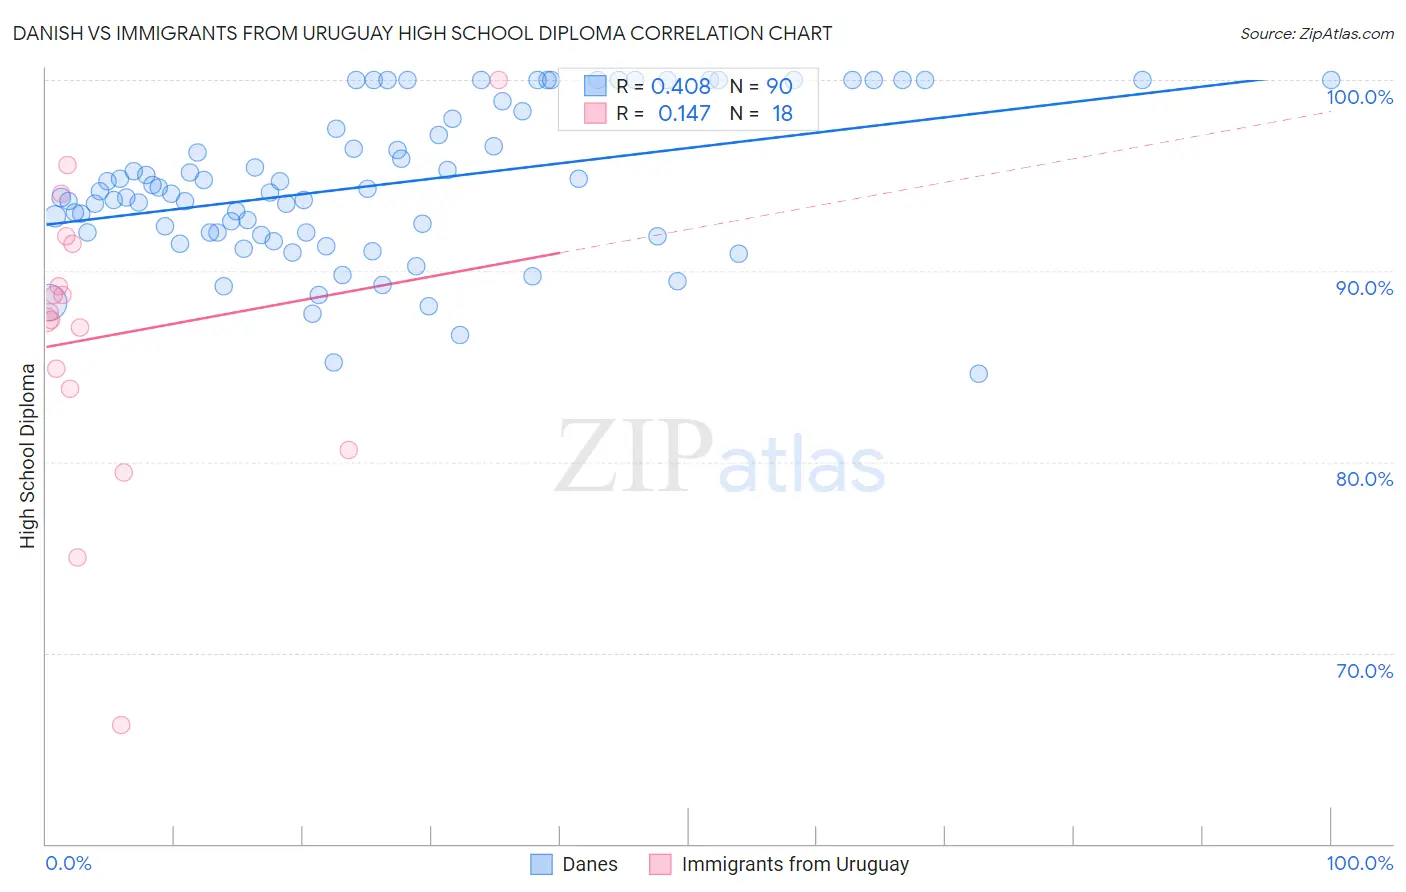
Danish vs Immigrants from Uruguay High School Diploma Correlation Chart
The statistical analysis conducted on geographies consisting of 474,193,674 people shows a moderate positive correlation between the proportion of Danes and percentage of population with at least high school diploma education in the United States with a correlation coefficient (R) of 0.408 and weighted average of 91.8%. Similarly, the statistical analysis conducted on geographies consisting of 133,259,667 people shows a poor positive correlation between the proportion of Immigrants from Uruguay and percentage of population with at least high school diploma education in the United States with a correlation coefficient (R) of 0.147 and weighted average of 87.6%, a difference of 4.8%.
High School Diploma Correlation Summary
| Measurement | Danish | Immigrants from Uruguay |
| Minimum | 84.6% | 66.2% |
| Maximum | 100.0% | 100.0% |
| Range | 15.4% | 33.8% |
| Mean | 94.5% | 86.6% |
| Median | 94.1% | 87.6% |
| Interquartile 25% (IQ1) | 92.0% | 83.8% |
| Interquartile 75% (IQ3) | 98.3% | 91.4% |
| Interquartile Range (IQR) | 6.4% | 7.6% |
| Standard Deviation (Sample) | 4.0% | 7.8% |
| Standard Deviation (Population) | 4.0% | 7.6% |
Similar Demographics by High School Diploma
Demographics Similar to Danes by High School Diploma
In terms of high school diploma, the demographic groups most similar to Danes are Polish (91.9%, a difference of 0.050%), Bulgarian (91.8%, a difference of 0.050%), Luxembourger (91.7%, a difference of 0.080%), Eastern European (91.9%, a difference of 0.090%), and Finnish (91.7%, a difference of 0.10%).
| Demographics | Rating | Rank | High School Diploma |
| Slovaks | 100.0 /100 | #6 | Exceptional 92.0% |
| Immigrants | India | 100.0 /100 | #7 | Exceptional 92.0% |
| Chinese | 100.0 /100 | #8 | Exceptional 92.0% |
| Latvians | 100.0 /100 | #9 | Exceptional 92.0% |
| Croatians | 100.0 /100 | #10 | Exceptional 92.0% |
| Eastern Europeans | 100.0 /100 | #11 | Exceptional 91.9% |
| Poles | 100.0 /100 | #12 | Exceptional 91.9% |
| Danes | 100.0 /100 | #13 | Exceptional 91.8% |
| Bulgarians | 100.0 /100 | #14 | Exceptional 91.8% |
| Luxembourgers | 100.0 /100 | #15 | Exceptional 91.7% |
| Finns | 100.0 /100 | #16 | Exceptional 91.7% |
| Immigrants | Singapore | 99.9 /100 | #17 | Exceptional 91.7% |
| Germans | 99.9 /100 | #18 | Exceptional 91.7% |
| Maltese | 99.9 /100 | #19 | Exceptional 91.6% |
| Czechs | 99.9 /100 | #20 | Exceptional 91.6% |
Demographics Similar to Immigrants from Uruguay by High School Diploma
In terms of high school diploma, the demographic groups most similar to Immigrants from Uruguay are Immigrants from Colombia (87.6%, a difference of 0.010%), Immigrants from South America (87.6%, a difference of 0.050%), Immigrants from Senegal (87.6%, a difference of 0.060%), Ghanaian (87.7%, a difference of 0.11%), and Senegalese (87.7%, a difference of 0.15%).
| Demographics | Rating | Rank | High School Diploma |
| Immigrants | Eritrea | 1.7 /100 | #246 | Tragic 87.8% |
| Immigrants | Costa Rica | 1.7 /100 | #247 | Tragic 87.8% |
| Spanish Americans | 1.5 /100 | #248 | Tragic 87.7% |
| Senegalese | 1.5 /100 | #249 | Tragic 87.7% |
| Immigrants | Nigeria | 1.5 /100 | #250 | Tragic 87.7% |
| Ghanaians | 1.4 /100 | #251 | Tragic 87.7% |
| Immigrants | South America | 1.2 /100 | #252 | Tragic 87.6% |
| Immigrants | Uruguay | 1.0 /100 | #253 | Tragic 87.6% |
| Immigrants | Colombia | 1.0 /100 | #254 | Tragic 87.6% |
| Immigrants | Senegal | 0.9 /100 | #255 | Tragic 87.6% |
| Africans | 0.7 /100 | #256 | Tragic 87.5% |
| Bahamians | 0.7 /100 | #257 | Tragic 87.5% |
| Immigrants | Ghana | 0.5 /100 | #258 | Tragic 87.4% |
| Immigrants | Western Africa | 0.5 /100 | #259 | Tragic 87.4% |
| Cajuns | 0.4 /100 | #260 | Tragic 87.3% |